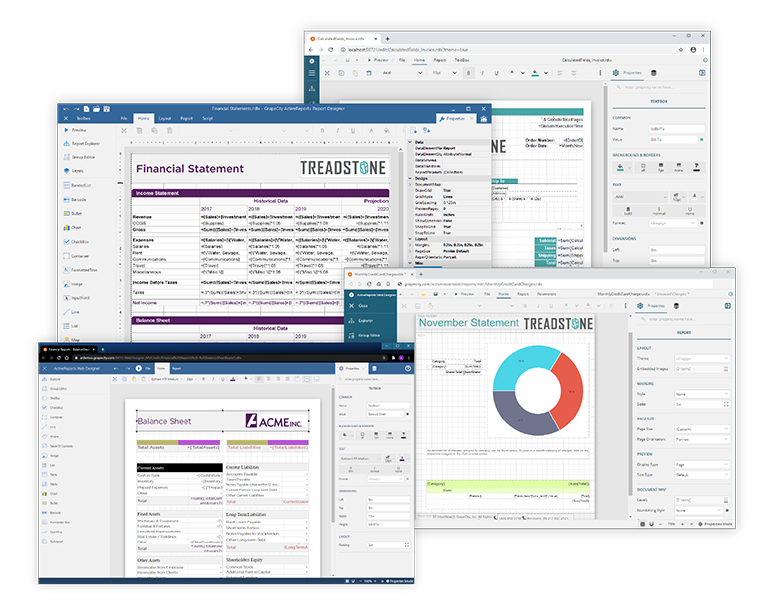
High-Performance .NET Report Web Designer for End Users
The Web Designer component allows you to implement a web designer in your ASP.NET MVC and ASP.NET Core MVC applications to enable end users to create or modify reports directly.
List of Services
- Easily create new reports with built-in drag-and-drop, snap lines, guides, and wizard features.
- Gain deeper insights from your data using rich interactive features like drill down, drill through, and sorting.
- Provides a flexible API for advanced control and customization.
- Easy to use with an Office-like UI.
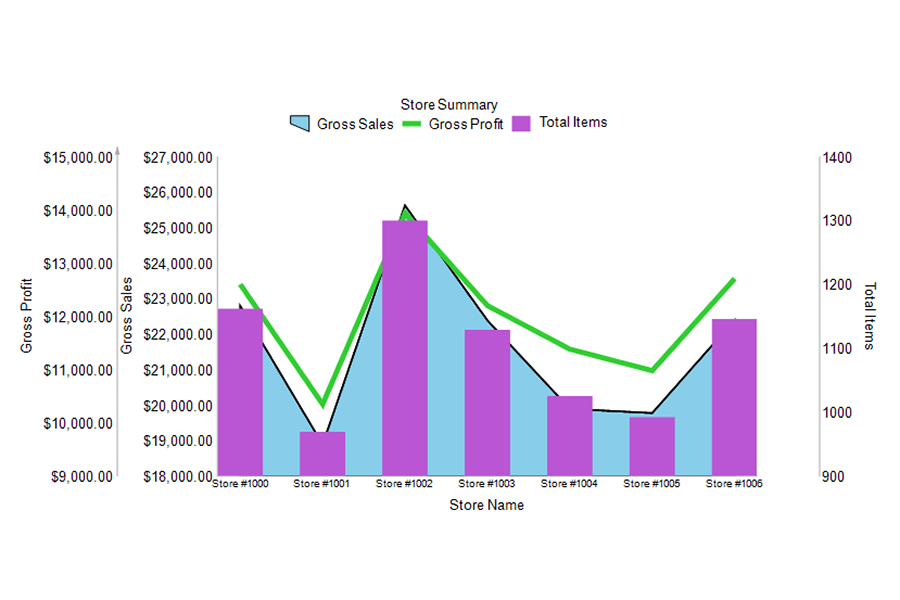
A Full Suite of Data Visualization Controls
With the full power of ActiveReports, the End-User Report Designer for Web offers users the functionality to create virtually any report they can think of. Users can create periodic letters, regulatory forms, invoices, financial portfolios, rich cross-tab, or pivot table reports, all in the same web designer.
Best ASP.NET Reporting Features
-
-
-
-
-
-
-
-
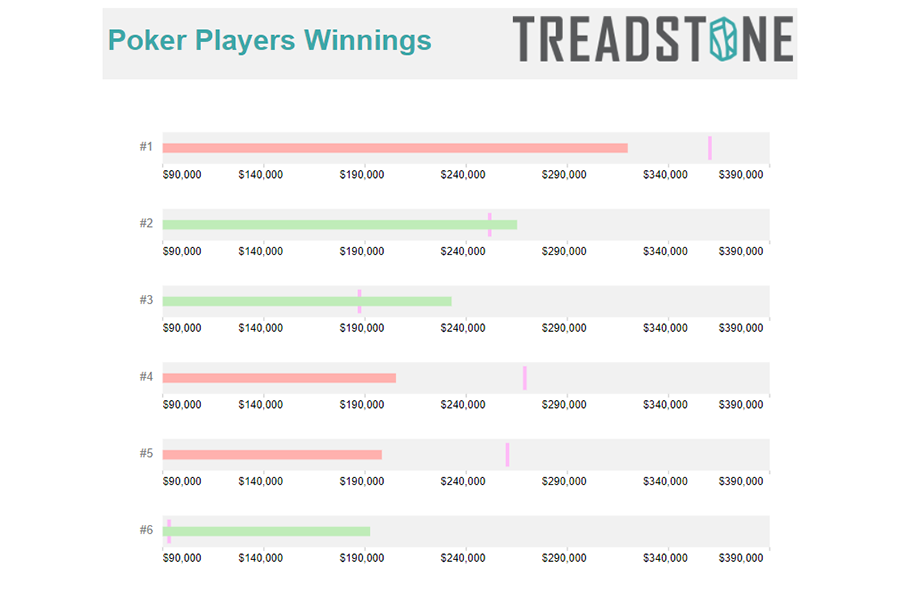
Bullet graph
The Bullet control is an easy-to-read linear gauge that's a great alternative to using data visualization dashboards. It combines multiple bullets into a data area to display a single value side-by-side.
View Demo -
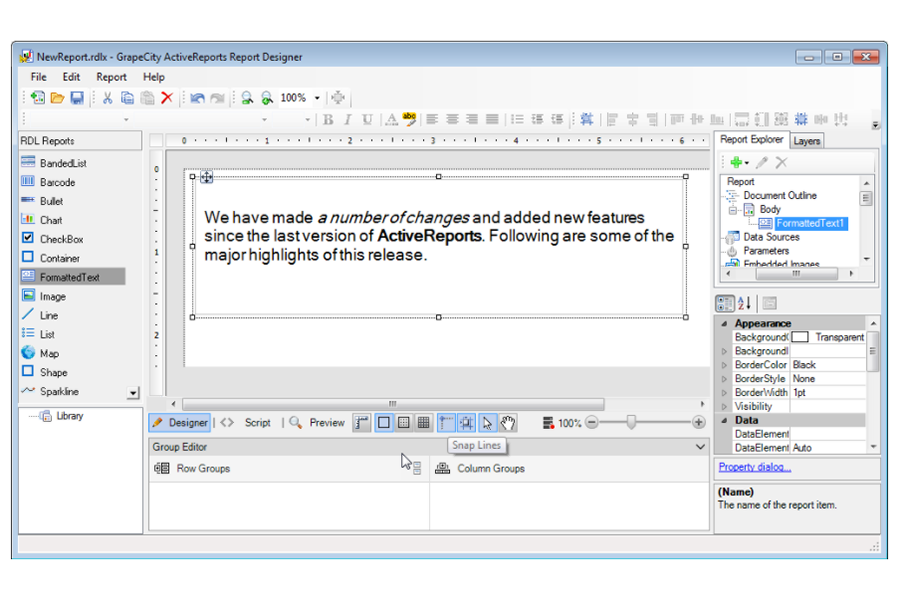
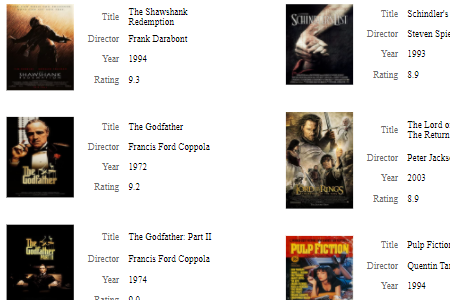
Format text
The FormattedText control allows you to write HTML text in .NET and .NET Core reports. It's often used to create mail merge reports, and its design-time rendering allows for WYSIWYG output.
View Demo -
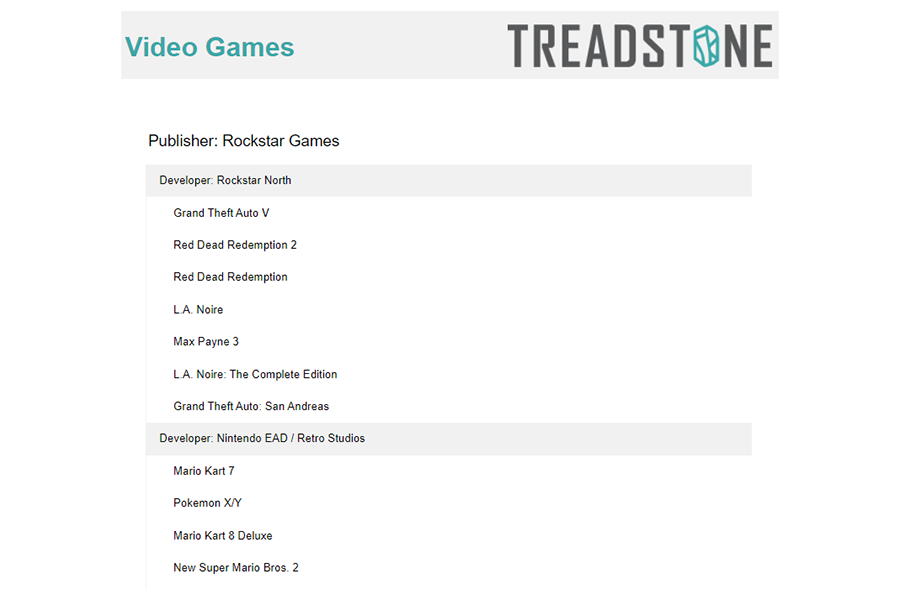
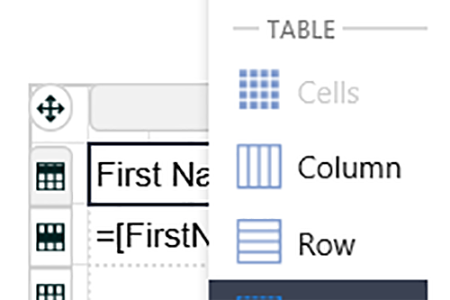
BandedList
The BandedList data region is a collection of free-form bands. It consists of three bands (header, footer, and details) with optional grouping built-in. It is a nested report control that repeats the detail band for every row of data.
View Demo -
-
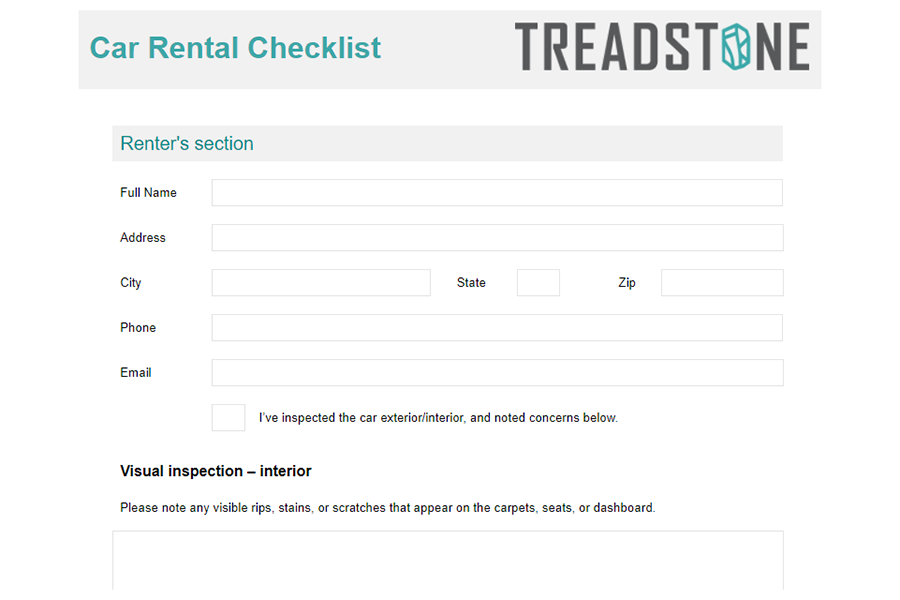
InputField
The InputField control makes it easy to create editable PDFs. Quickly create PDF forms by setting the "Type" property of the InputField control to Text or Checkbox.
View Demo

Ask anything!
Please share your vague concerns and questions about ActiveReports.NET with MESCIUS's expert team. We empathize with your concerns and are here to help.
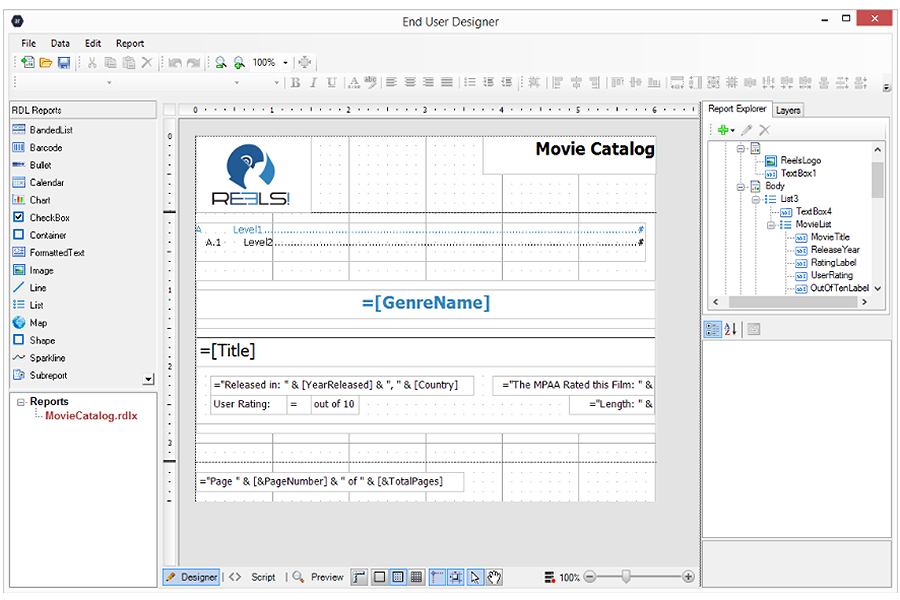
Intuitive and Easy-to-Use Ad Hoc Report Design
Web-based end-user report designer for all users
We built the ActiveReports end-user web designer with every user in mind.
Anyone can create an online report using just a web browser.

Additional Features
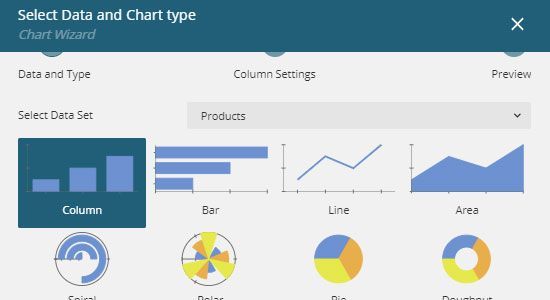
Built-in wizard
Visualize trends and analyze data using over 35 different chart types. Advanced built-in features, including drill-through, links, filtering, and parameters, allow users to better understand and predict current and future trends.
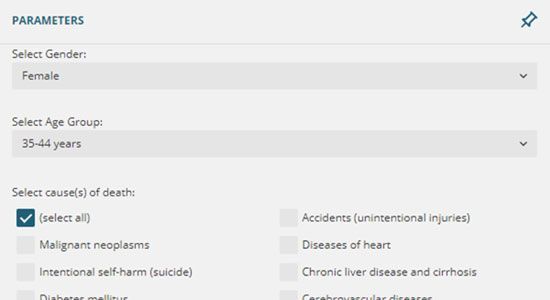
Parameters and Prompts
Parameters are the most widely used feature for interacting with RDL/RDLC reports at runtime. Add parameters, filters, and prompts to your reports to allow end users to select the data they want to see in the report.
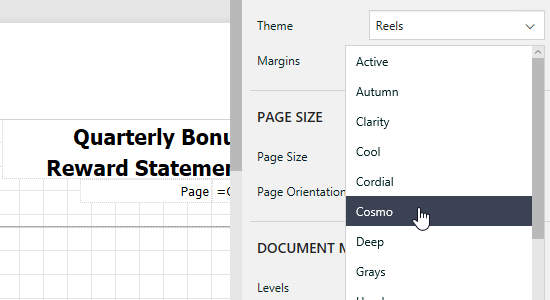
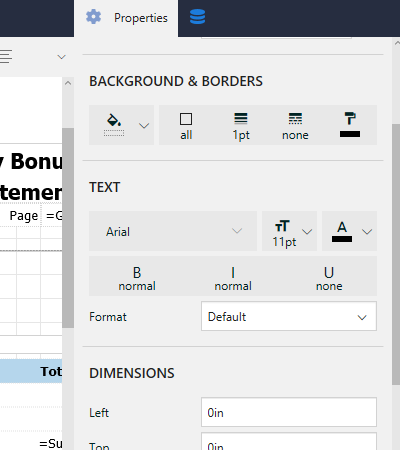
Theme and Style
Set styles for individual report items or select a theme to apply to report elements for complementary colors without having to select each one.