Gain a Business insight using Pivot Tables!
Pivot Tables are powerful data summary and reporting tools that allow you to quickly organize, extract, and analyze large amounts of data.
Visualize complex data, you can improve business intelligence, discover trends, and gain new insights.
SpreadJS now supports pivot tables, allowing users to quickly analyze data in JavaScript spreadsheets.
The screen below is an actual SpreadJS implementation. Click on each HTML/CSS/JS tab to check the code, and edit the code yourself to see the resulting results.
See the Pen 피벗테이블 + 피벗패널 by GrapeCity Korea ( @GrapeCity-Korea) on CodePen.
Generate quick, easy-to-read reports in seconds using field and panel features, and leverage the familiar UI to easily organize and summarize data using built-in aggregations, pivot table field lists, and calculated fields. Completely customize your application's requirements and let SpreadJS PivotTables perform complex, interactive analysis for your application.
JavaScript pivot tables are the easiest and most effective way to analyze complex data sets. Check out some real-world use cases.
Interactive Data Analysis
With just a few lines of code and a few clicks in SpreadJS Designer, you can reduce your work time to minutes, reduce the possibility of errors due to manual creation, and focus more time on efficiently interpreting and analyzing your data with SpreadJS PivotTables.
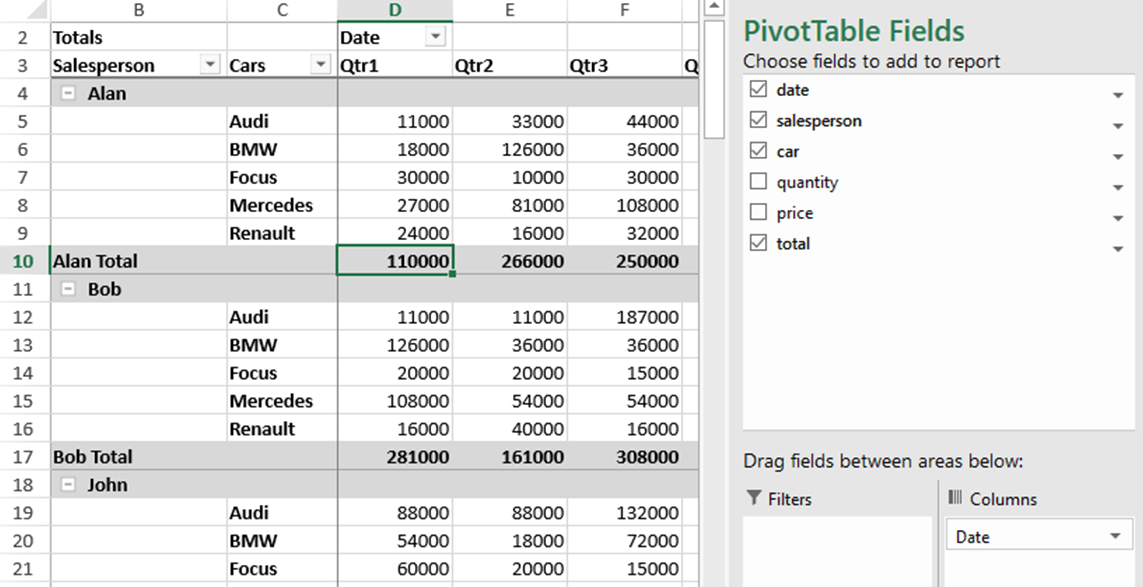
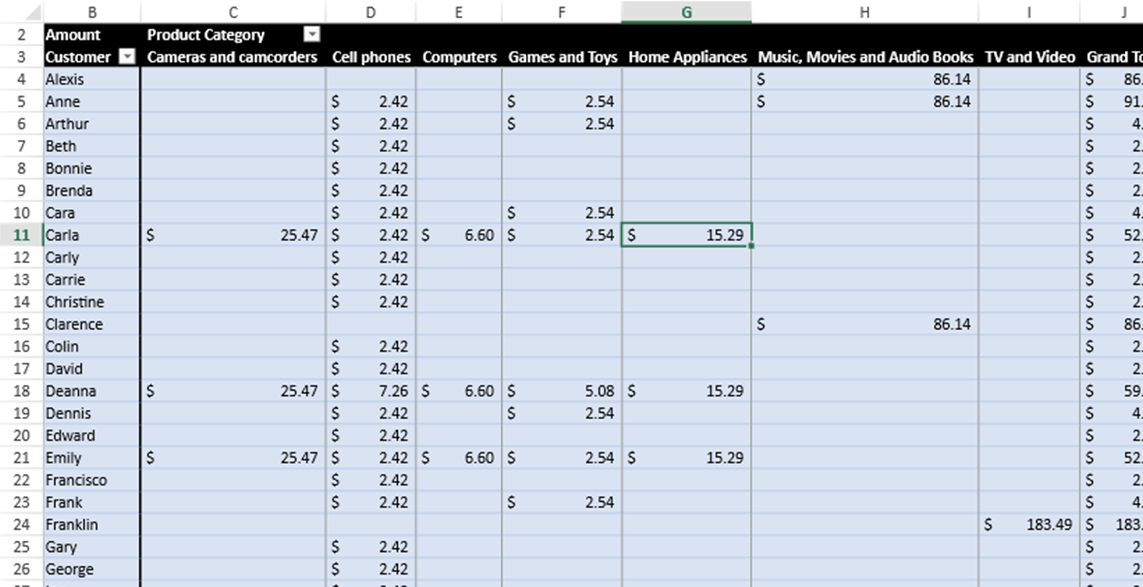
Sales and Forecast
SpreadJS PivotTables transforms reporting into manageable tasks, delivering the information you need, how you want it, and when you want it. Aggregate sales figures directly with multiple fields and filters, providing a concise data view with just a few lines of SpreadJS code.
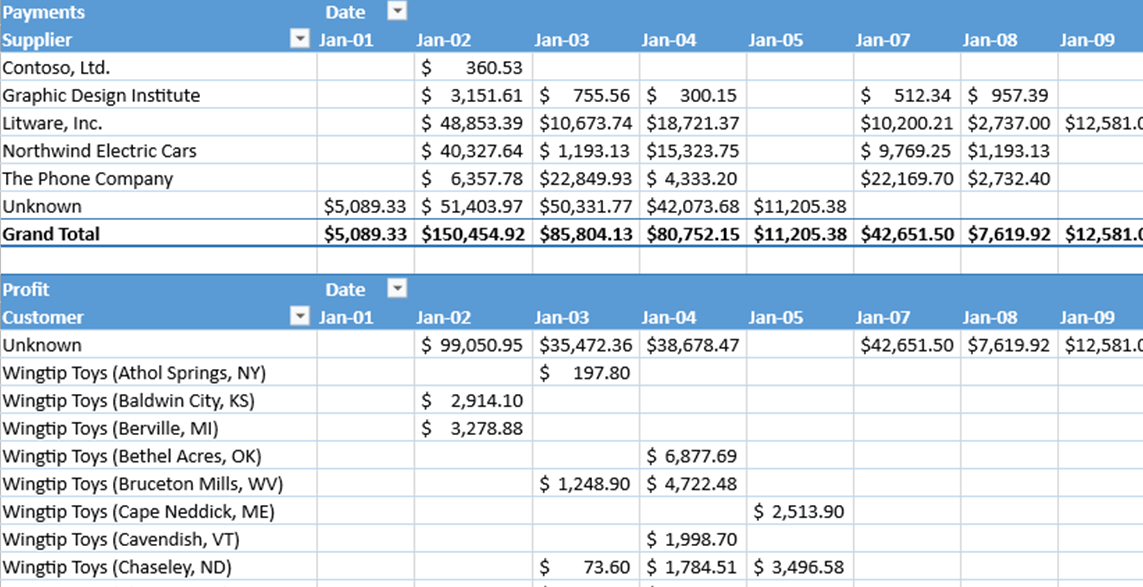
Financial Report
Income statements and balance sheets can be quickly and easily combined with SpreadJS Pivot Tables. Summarize large amounts of data using calculated fields for clear, concise, user-defined tables that highlight sub-totals for profit, including gross income and operations.
KPI
Create tables focused on various strategies, variables, inputs, and outputs to track your company's growth, KPIs, and analytics for data visualization.
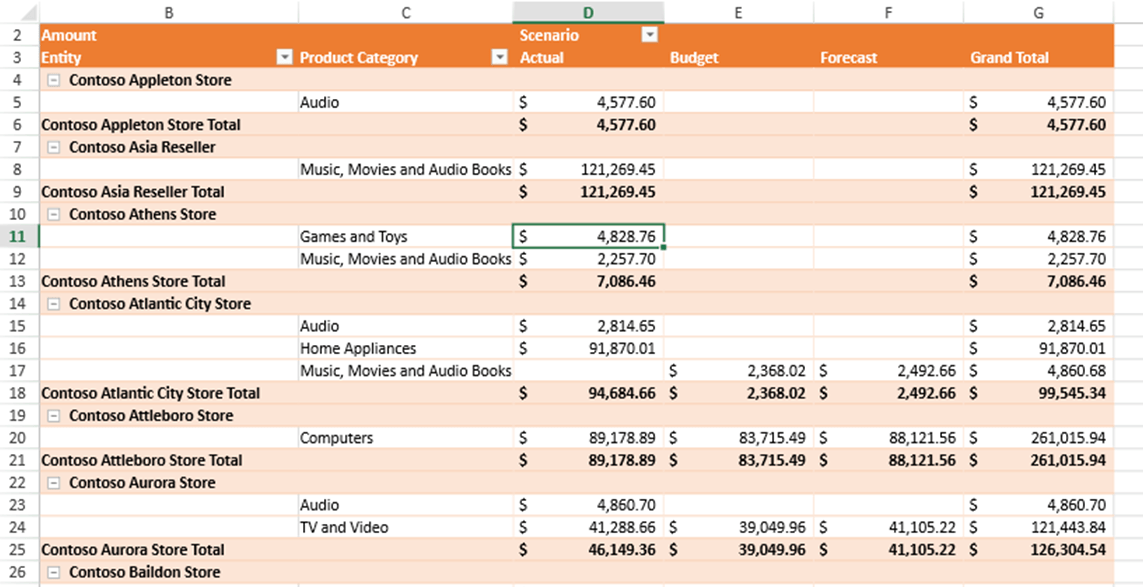
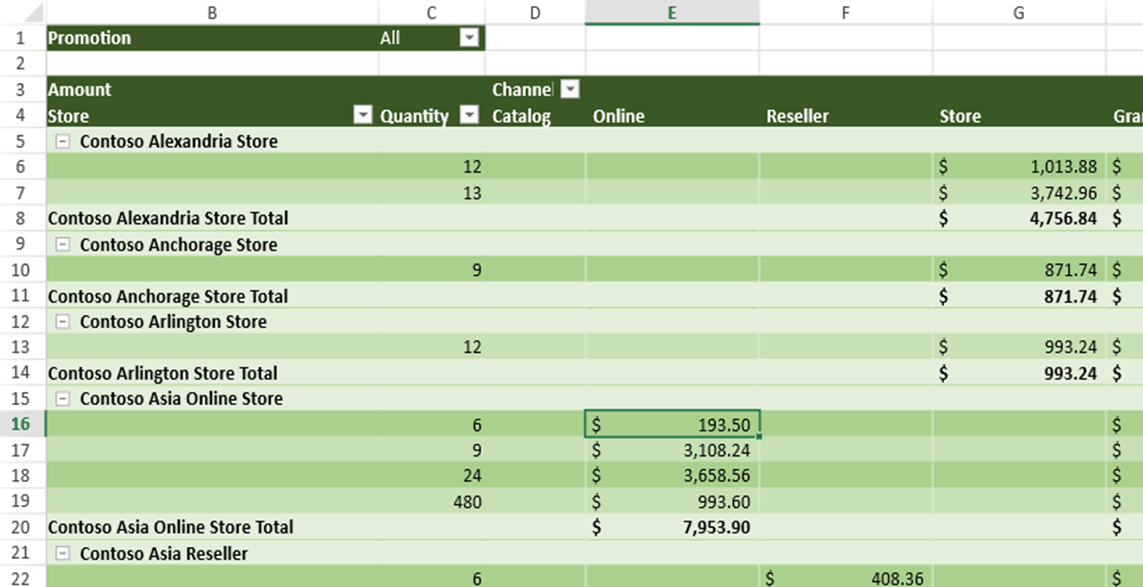
Budgeting
SpreadJS PivotTables makes budgeting simple and easy. Compare budgets using detailed pivot tables, track actual costs against projected values, and summarize spending across multiple offices and product lines with a simple drag-and-drop interface.

Ask Anything!
Share your questions and concerns about SpreadJS with the MESCIUS expert team. We are here to listen and help.
SpreadJS Pivot Table Key Features
-
CustomList Item 1Provides the ability to modify the standard PivotTable display using specific parameters. You can programmatically customize the appearance of control filters, rows, columns, and headers.
-
Report LayoutList Item 2
It offers three report layout options: Click the drop-down menu in the Compact Form Outline Form Tabluar Form demo to choose a layout optimized for your JavaScript reporting.
-
PanelList Item 3
In a PivotTable, fields are arranged using the PivotTable panel. The arrangement and settings determine the final result of the pivotTable. Choose from a variety of fields to add to your report based on the contents of your data source. To customize the control, simply drag and drop other fields within the panel.
-
ThemeList Item 4PivotTable includes 85 themes, including three themes: Light, Medium, and Dark. Users can customize the PivotTable to match their company's color scheme. You can try changing the theme yourself through the demo.
-
FieldThe placement and order of PivotTable fields in each area affects their overall appearance. Users can adjust the initial appearance of data in the PivotTable by dragging field values up or down within the area. PivotTables support label filters, value filters, sorting, grouping, and collapsing features.
-
ExampleYou can use the View Manager to create, manage, and save views of a PivotTable. A view is the state of a PivotTable at a specific moment, saved using the View Manager.
-
Conditional RuleSimilar to the default SpreadJS conditional formatting, PivotTable also supports conditional rules. You can set them for specific dimensions, and they will remain applied to the specified dimensions regardless of how the PivotTable layout changes.
-
PrintPivotTables support printing with a variety of options. Include expand/collapse icons, repeat row labels for each pivot table, and set print titles.
-
Context MenuCustomers have full control over various properties of the PivotTable. With a single right-click, they can refresh the PivotTable, remove data, add data summaries, change how values are displayed, display PivotTable details in a separate sheet, and change value field settings.
-
DetailsPivot tables in SpreadJS allow you to retrieve pivot details for a selected area, returning a two-dimensional array.
Diverse Enterprise Business Features Powered by SpreadJS
Explore the Business Excel Add-Ons for SpreadJS
SpreadJS provides Excel-based features tailored to diverse enterprise business needs, enabling fast and efficient development of even the most complex business systems.
Excel Editor
Deliver a complete web Excel editor built on HTML5 and JavaScript to your end users.
-
Full Excel Compatibility A web editor that is fully compatible with existing Excel files.
-
Familiar UI/UX Excel menus and interface your users already know
-
Powerful Customization JS Excel library and API support for editor customization
Real-Time Collaboration
Build an environment where multiple users can collaborate on a single sheet simultaneously.
-
Server Framework Build a stable Collaboration server based on Node.js
-
Real-Time Collaboration Multi-user simultaneous input with live user action and cursor display
-
Conflict Prevention Precise conflict control and permission management powered by OT engine
AI Assistant
Maximize productivity with natural language formula generation and data analysis.
-
Multi-AI Model Support Connect with OpenAI, Gemini, Claude, and custom in-house AI
-
Natural Language Command Generate and explain Excel formulas and auto-build pivot tables
-
Excel AI Functions Dedicated AI function library for data analysis
Gantt Sheet
Integrate project scheduling and resource management into your Excel sheet.
-
Project Management Full support for timescales, task bars, calendars, and more
-
Data Binding Easy data binding via DataManager
-
Flexible Compatibility Import/export support based on Excel and JSON
Report Sheet
Transform complex business data into dynamic Excel reports.
-
Dynamic Reporting JSON-based data binding and automatic report generation
-
Professional Styling Consistent report layouts with precise formatting
-
Advanced Analytics Cross-sheet references and data aggregation support
Data Chart
Visualize Excel data and create intuitive dashboards.
-
Dashboard Designer A dedicated designer for building Excel dashboards without coding
-
Diverse Charts Support for various Excel chart types with real-time data updates
-
Easy Binding Fast and simple JSON data connection via DataManager