Financial Charts for .NET Apps
List of Services
Quickly build advanced stock dashboards using ComponentOne financial charts.
- Provides 9 professional financial charts
- Built-in calculation engine
- WinForms, WPF, UWP, ASP.NET MVC
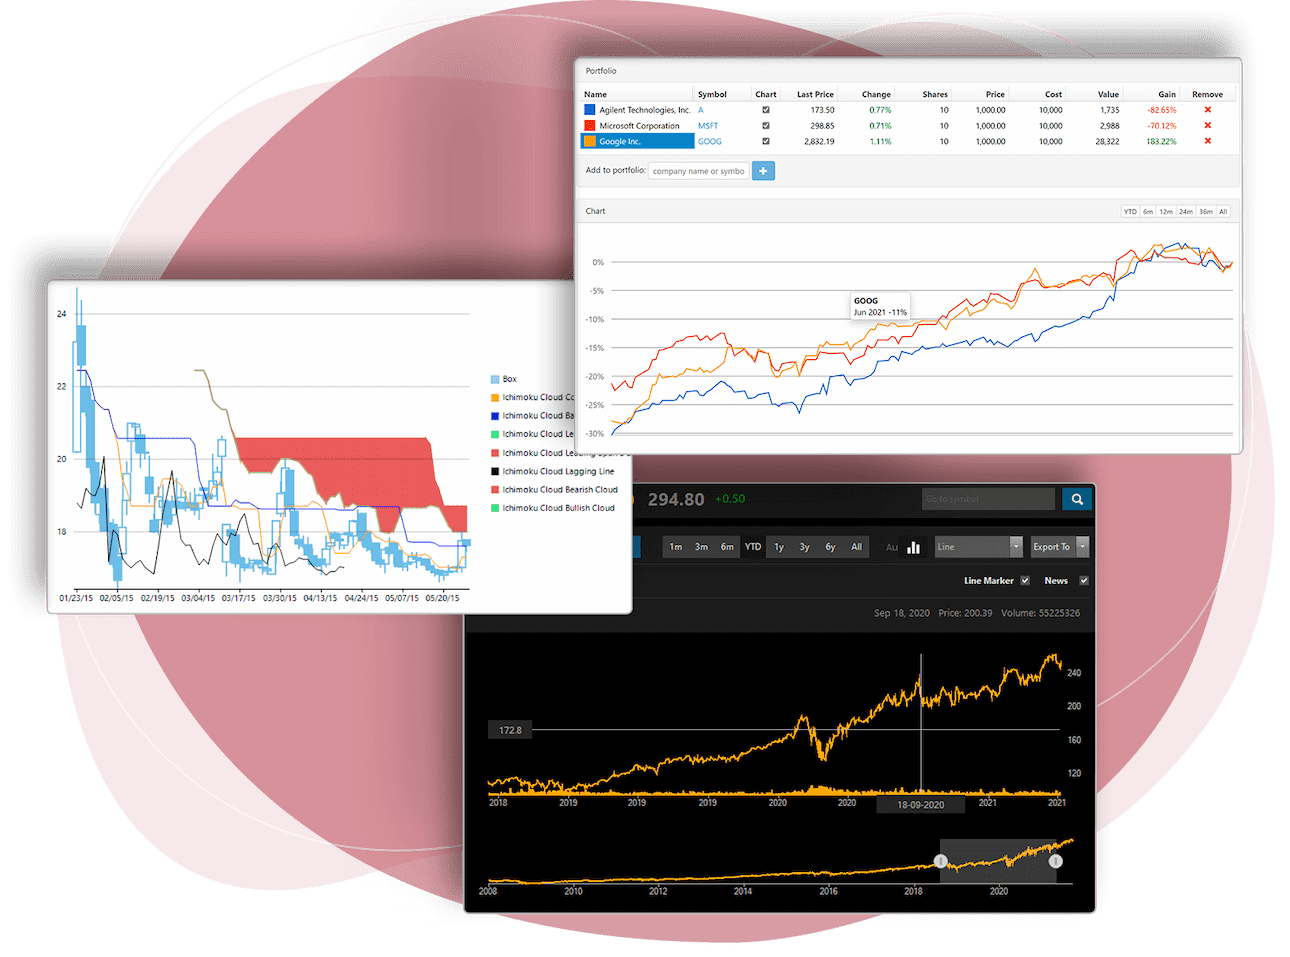
Why Choose FinancialChart?

Ask anything!
Share your concerns and questions about ComponentOne with MESCIUS's expert team. We empathize with your concerns and are here to help.
Bar chart type
-
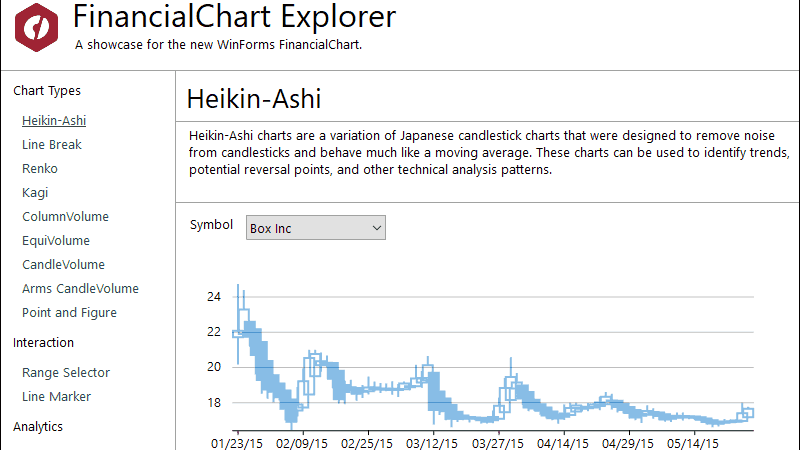
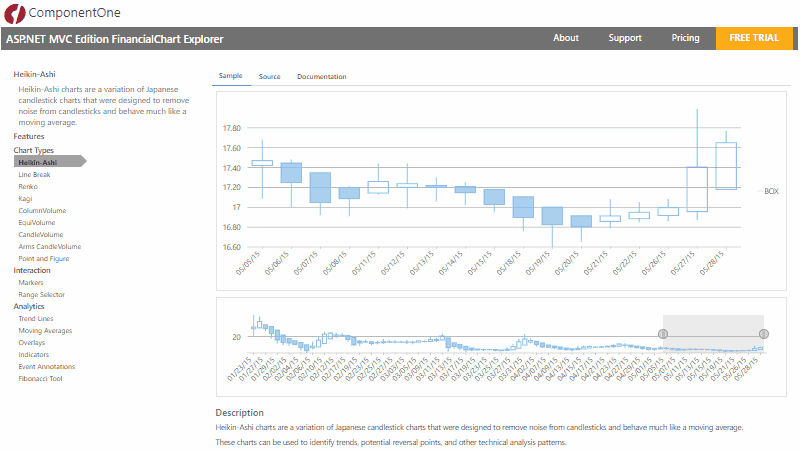
Heikin-Ashi
Heikin-Ashi charts are identical to standard candlestick charts, but they use a specific formula to filter out noise and are designed to visualize the average fluctuations in stock prices.
ASP.NET MVC Demo -
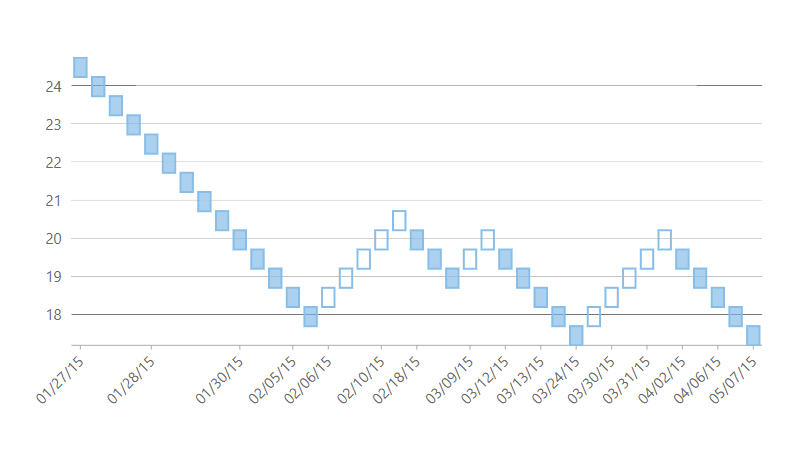
Renko
Renko charts focus solely on price changes within a specific amount, completely ignoring time. This allows users to easily visualize data trends by eliminating the noise commonly found in cylinder charts. Another unique feature of Renko charts is that each block/brick is of the exact same size (height).
ASP.NET MVC Demo -
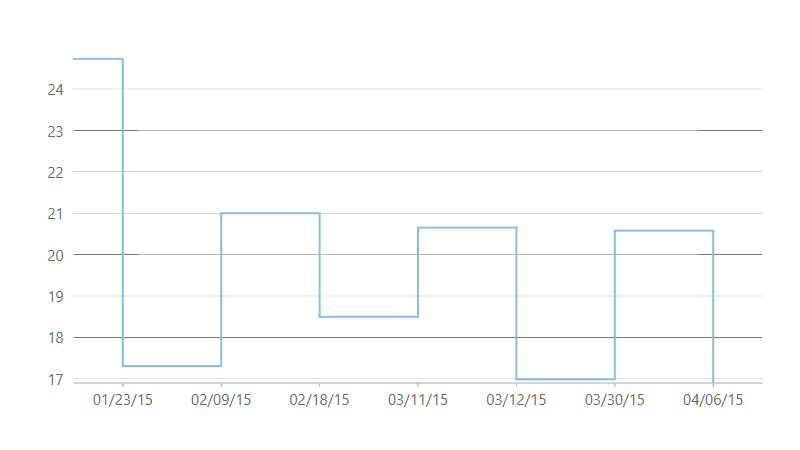
Kagi
While similar to a step chart, the KAGI completely ignores time and focuses on market reversals of predetermined amounts. A change in the thickness (and color) of the KAGI lines indicates a market reversal.
ASP.NET MVC Demo -

Line Break
Line charts, commonly called three-line reversal charts, are similar to element and figure charts. They ignore time and only change direction when the price moves a certain amount. A reversal occurs when the closing price exceeds the upper or lower limit of the previous line (vertical bar).
ASP.NET MVC Demo -
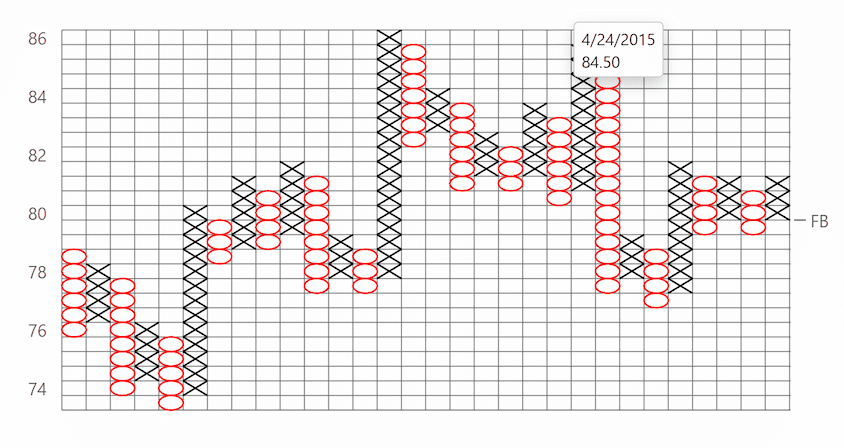
Elements and Figures
Elements and charts that graphically depict price movements help you determine clear points to enter and exit stock market trades. Rising stock prices are marked with an X, while falling stock prices are marked with an O.
ASP.NET MVC Demo -

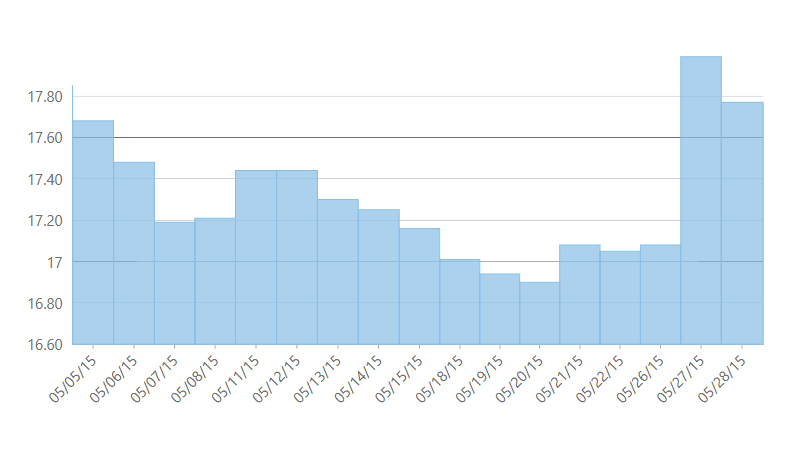
Vertical bar Volume
The vertical bar volume is the same as the vertical column chart type, but the width of each bar varies based on its percentage of the total volume.
ASP.NET MVC Demo -
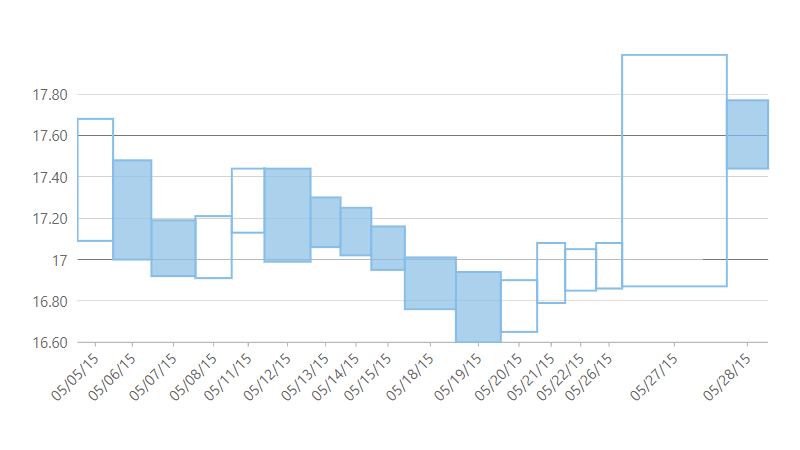
Equi Volume
Equi-volume charts are similar to range or high-low charts, but the width of each bar varies as a percentage of the total volume.
ASP.NET MVC Demo -
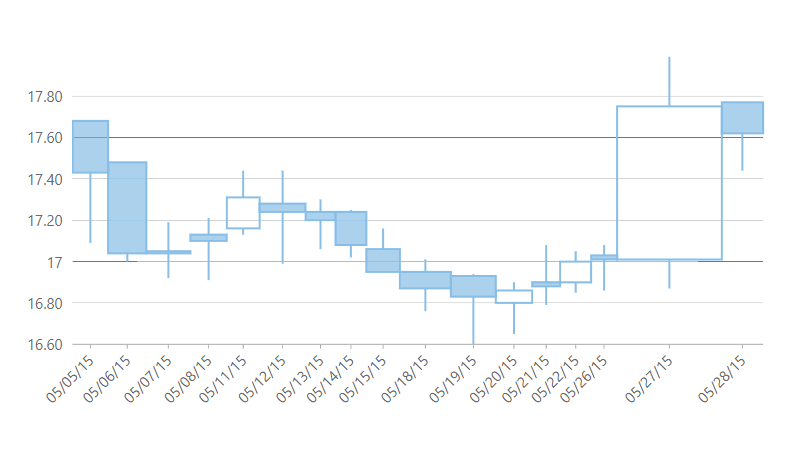
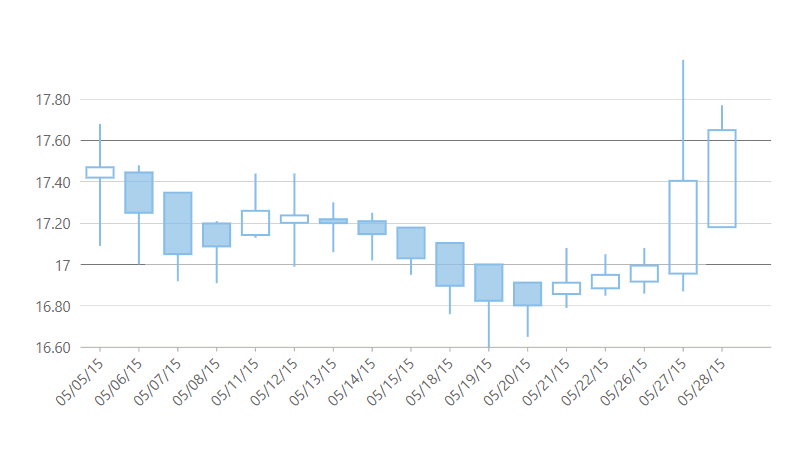
Candle Volume
Candle volume is the same as for the candlestick chart, but the width of each candle varies as a percentage of the total volume.
ASP.NET MVC Demo -
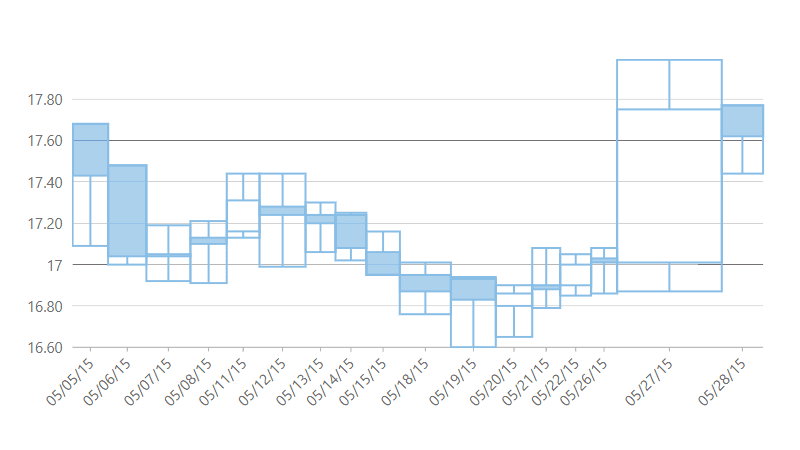
Arms Candle Volume
The Arms Candlestick Volume Chart is a combination of the Equi Volume Chart and the Candlestick Volume Chart.
ASP.NET MVC Demo
.NET Financial Charts Key Features
Indicators
Add technical indicators to predict market direction. Technical indicators are calculated by applying one or more formulas to the original data set. .NET Financial Charts supports the following indicators:
- Stochastic
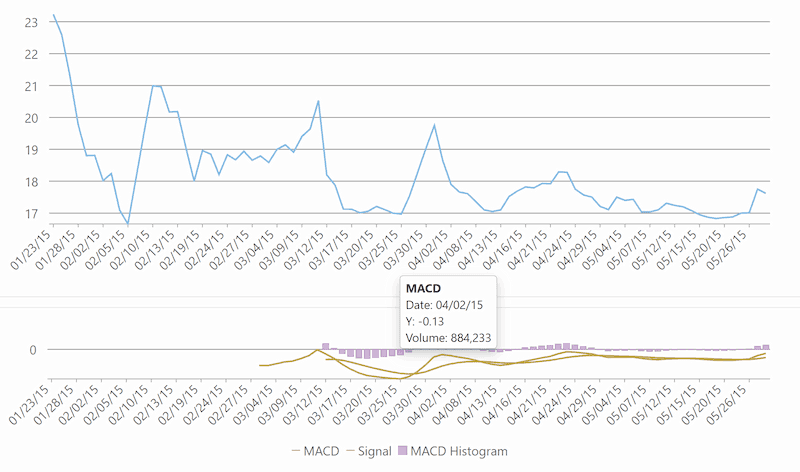
- MACD
- Relative Strength Index
- Technical indicator (Average True Range)
- Stock Momentum Index (Commodity Channel Index)
- Oversold & Overbought Levels (Williams %R)
Overlay
-
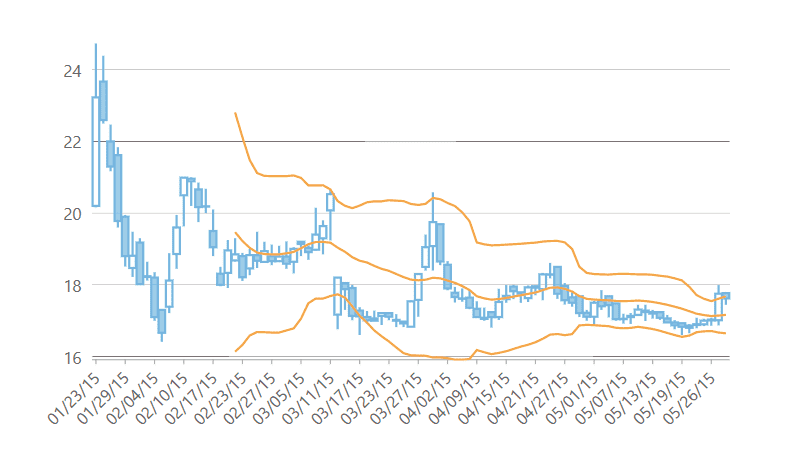
Bollinger Bands
These volatility bands are positioned above and below the moving average and use the standard deviation as a measure of volatility. As volatility increases, the bands widen, and as volatility decreases, the bands narrow.
ASP.NET MVC Demo -
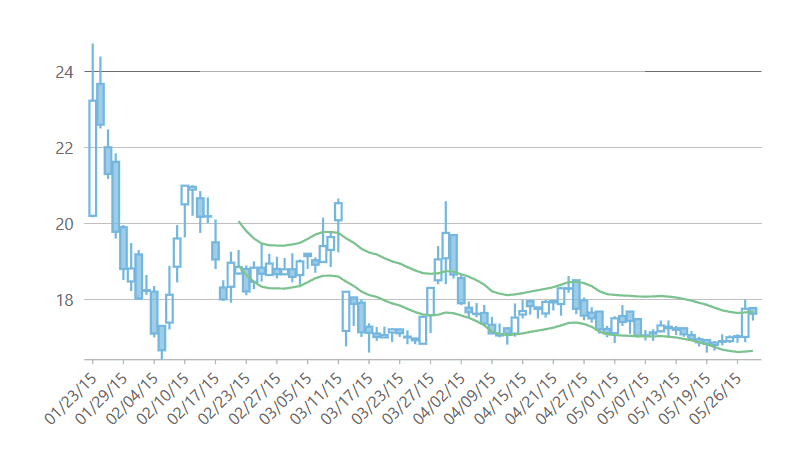
Envelopes
The envelope formed by two moving averages that define the upper and lower price range levels indicates extreme overbought and oversold conditions.
ASP.NET MVC Demo -
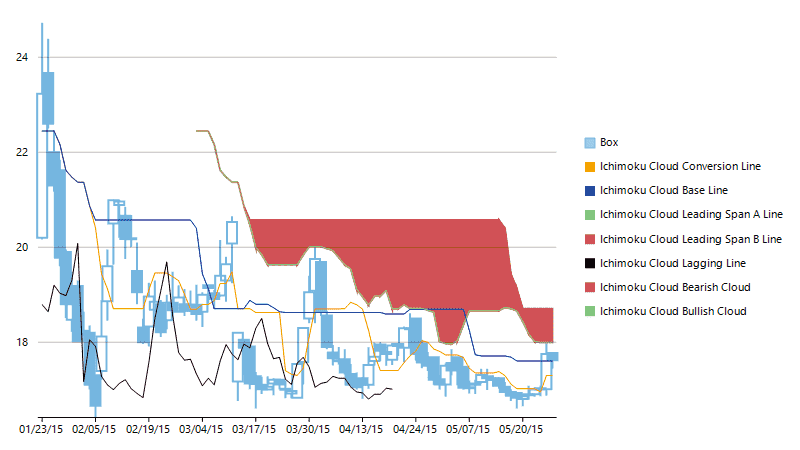
Ichimoku Cloud
This overlay is designed to provide all information about price trends at a glance, including direction, momentum, dynamic support and resistance levels, and trading signals.
WinForms | WPF | UWP
Fibonacci Tool
-

Arcs
Measured according to the Fibonacci sequence, these arcs indicate potential support or reversal areas to watch for as prices rise and then fall.
ASP.NET MVC Demo -
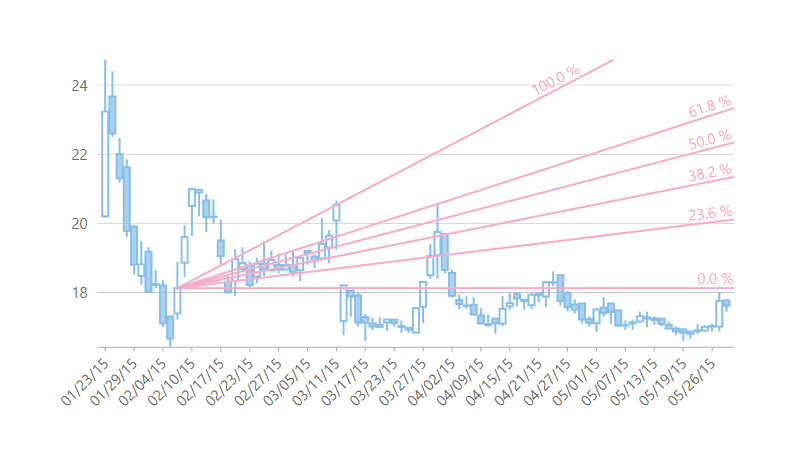
Fans
This fan includes a trendline that passes through the highest and lowest prices of a given period, and then divides the vertical distance between the two points according to the Fibonacci ratio.
ASP.NET MVC Demo -
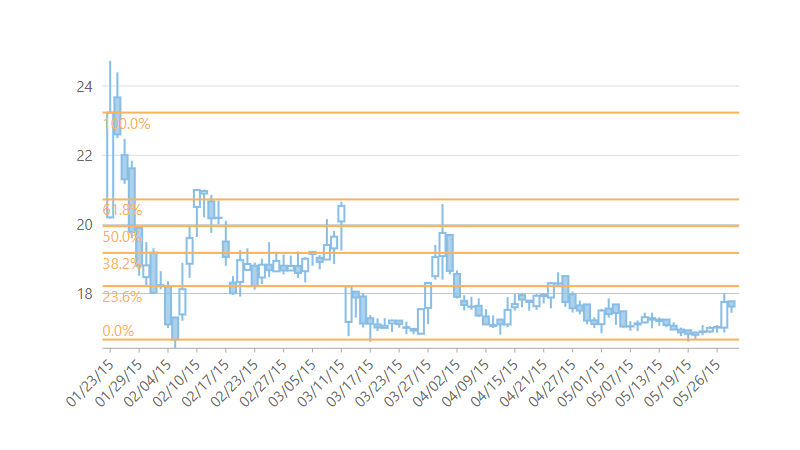
Retracements
This ratio is used to identify potential reversal levels as indicated by the Fibonacci sequence.
ASP.NET MVC Demo
Ask anything!
Share your concerns and questions about ComponentOne with MESCIUS's expert team. We empathize with your concerns and are here to help.
Additional Features
-
-
-
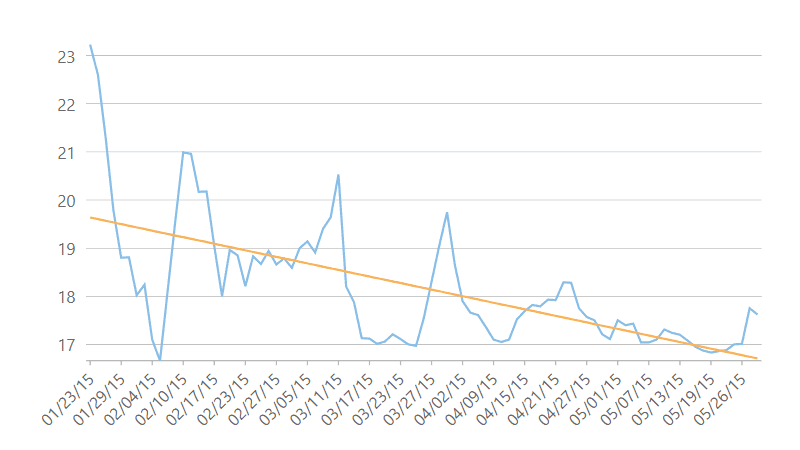
Trend Lines
Display trends over time using options like linear, exponential, and polynomial.
ASP.NET MVC Demo -
Moving Averages (Trend Lines)
Generates a set of averages of the original data set.
ASP.NET MVC Demo -

Zig Zag Overlays
Zigzag lines appear only when the price movement between the upper and lower transitions is greater than a specified percentage (typically 5%).
Try the .NET Financial Chart Demo
WinForms & WPF Demo Explorer
This desktop app includes all the WinForms and WPF demos, including the WinForms and WPF FinancialChart Explorer, Stock Chart, and Stock Analysis apps.
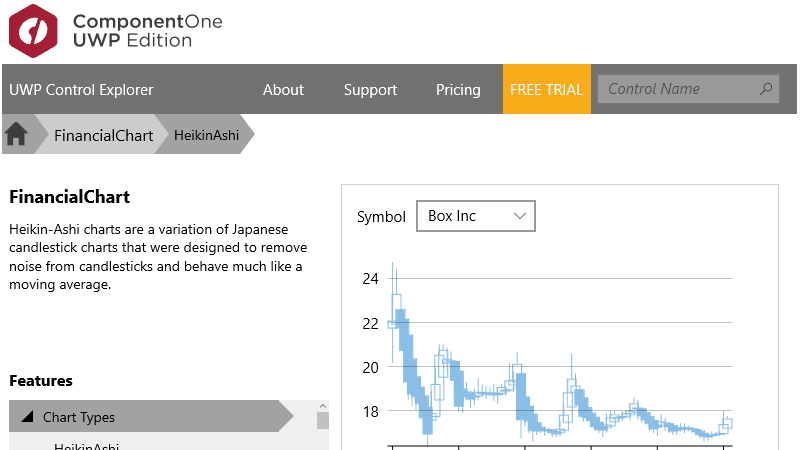
UWP Control Explorer
Download this control explorer from the Windows Store to experience all UWP UI controls, including UWP financial charts.
ComponentOne Enterprise Free Trial
ComponentOne Enterprise
Expand your development reach across all .NET platforms with ComponentOne Enterprise.