FlexPivot
List of Services
Excel-like Pivot Table and Chart Controls
- Provides a pivot panel UI for pivot tables, charts, and dynamic views.
- Import multiple data sources into multidimensional pivot tables, either online or from local OLAP cubes.
- FlexGrid is the best .NET data grid chosen by developers and is extensible.
- Desktop : WinForms, WPF
- Web : ASP.NET MVC, Wijmo JavaScript
Why Choose FlexPivot?

Ask anything!
Share your concerns and questions about ComponentOne with MESCIUS's expert team. We empathize with your concerns and are here to help.
FlexPivot Key Features
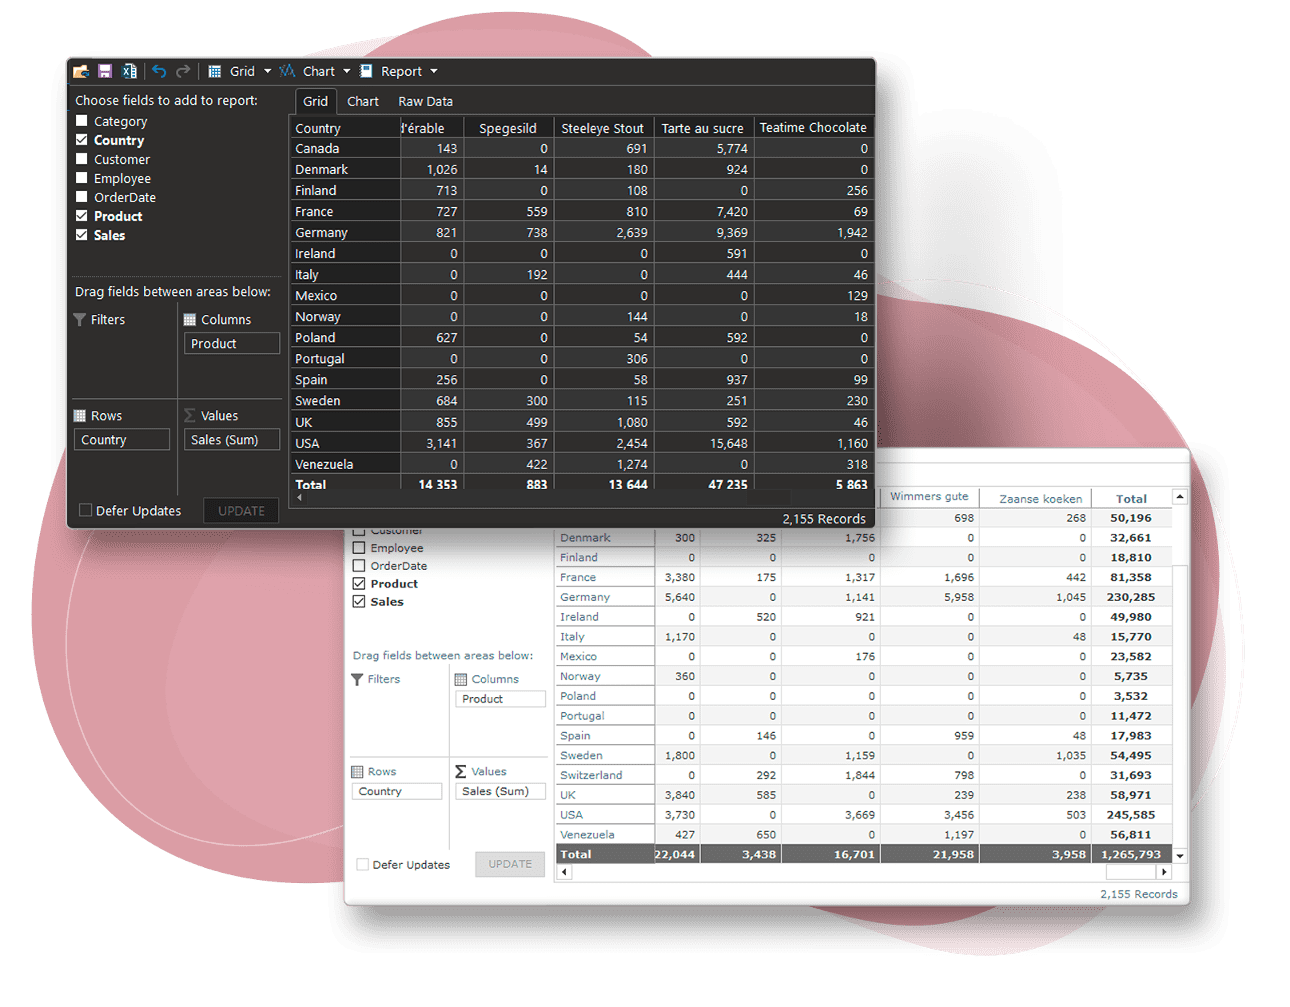
Smart and Intuitive Pivot Panel
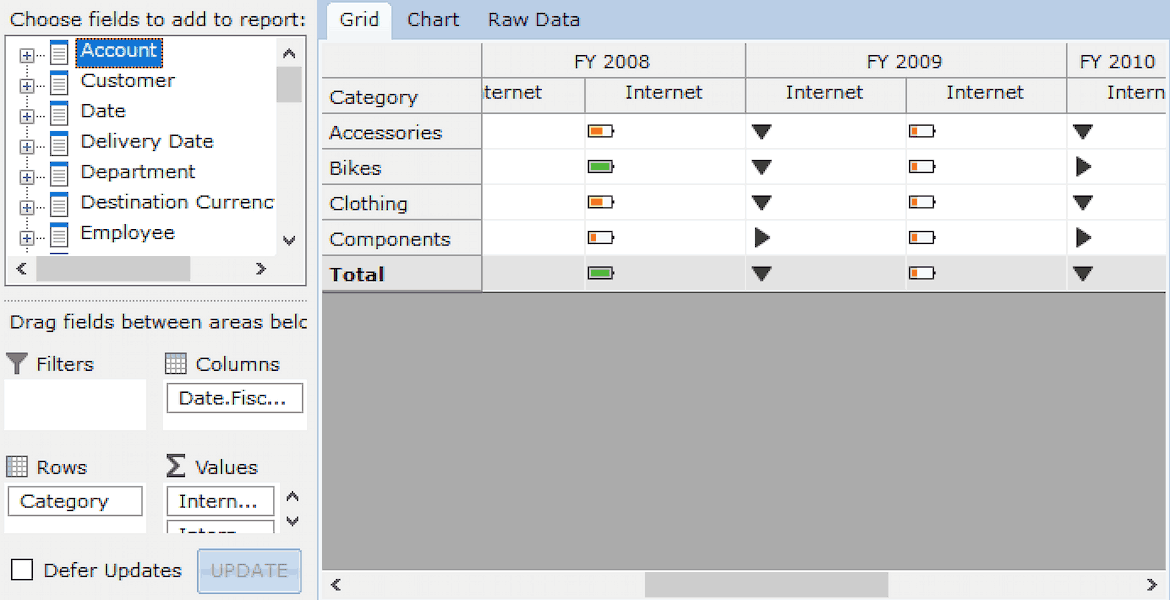
Drag and Drop
Allow users to drag fields into "view" lists representing row, column, value, and filter. The Excel-like panel design feels familiar to users. The panel is "smart" too because it can intelligently place fields based on their data type when you double-click them.
Aggregate Multiple Values
The pivot panel supports multiple value fields so that you may aggregate and visualize multiple columns per dimension, such as comparing units sold and total revenue. You can even use the same field multiple times, such as total (sum), count and count distinct.
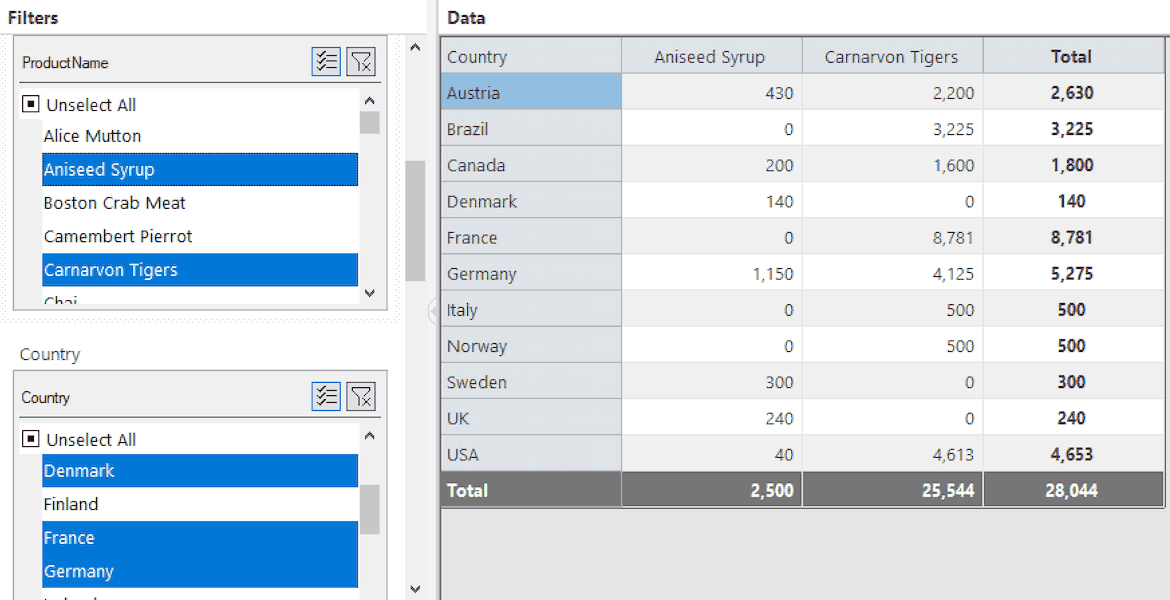
Filter and Slice Data
Enable users to filter data based on some conditions using value and range-based filters. Filter data based on multiple values or by some formula such as TopN to find the top or bottom data records. The separate slicer control also provides a quick way to edit filters at run-time. Supported in WinForms and ASP.NET MVC.
Data Summary & Display
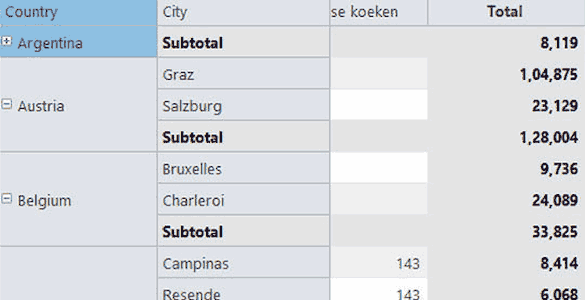
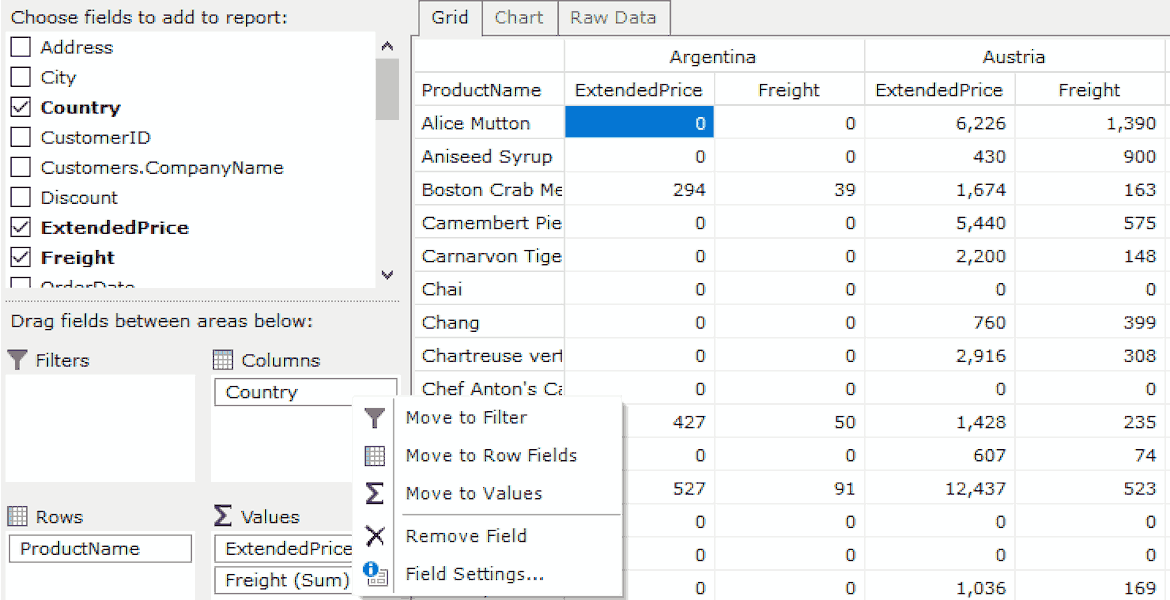
Aggregation and Summary
Dynamically group and aggregate data. FlexPivotGrid is an extension of FlexGrid and supports automatic data binding for each cell in the grid, grouped rows and columns, summaries, column resizing, data filtering, and drill-down details.
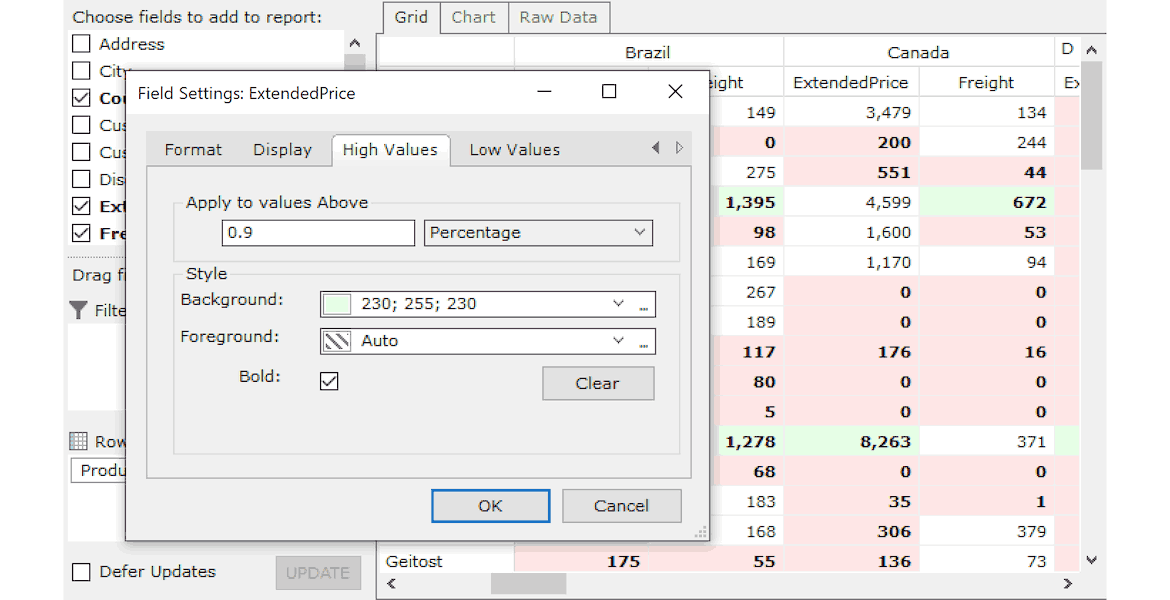
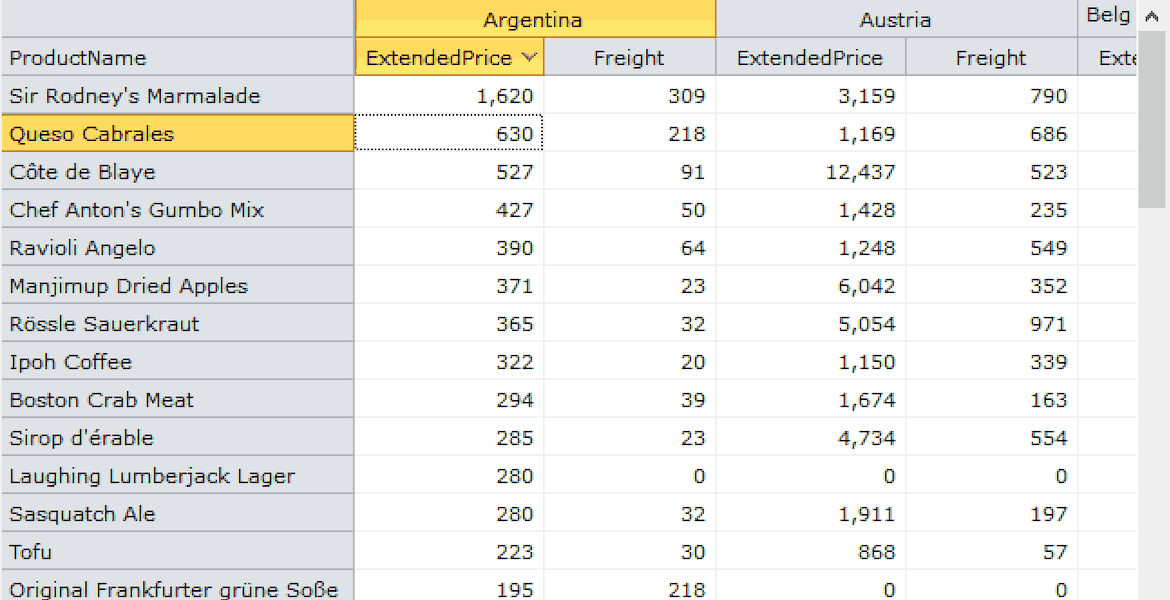
Conditional Formatting
You can apply conditional formatting at runtime using the built-in menu in the Pivot panel. Highlight high and low values by specifying text color, cell color, or text weight.
Connecting Data Sources

SQL Server & Excel Connection
The .NET pivot table components provide their own OLAP engine that works on top of a wide range of data sources including SQL Server and Excel. Pull multiple data sources into a single application and deliver data from online or local cubes that users can drill down and parse more meaningfully. With Data Engine Services you can use multiple data sources including SQL Server, SQL-based RDMS servers, NOSQL, web services and structured files.
Connect to a Microsoft SSAS cube
Build a complete front-end dashboard for your database using FlexPivot while writing just a couple lines of code. Connect directly to your Microsoft® SQL Server® Analysis Services (SSAS) cube without any server go-between. Users can build a multidimensional pivot table that slices and dices the dimensions, measures, and Key Performance Indicators (KPIs) present in the OLAP cube.
Data Visualization
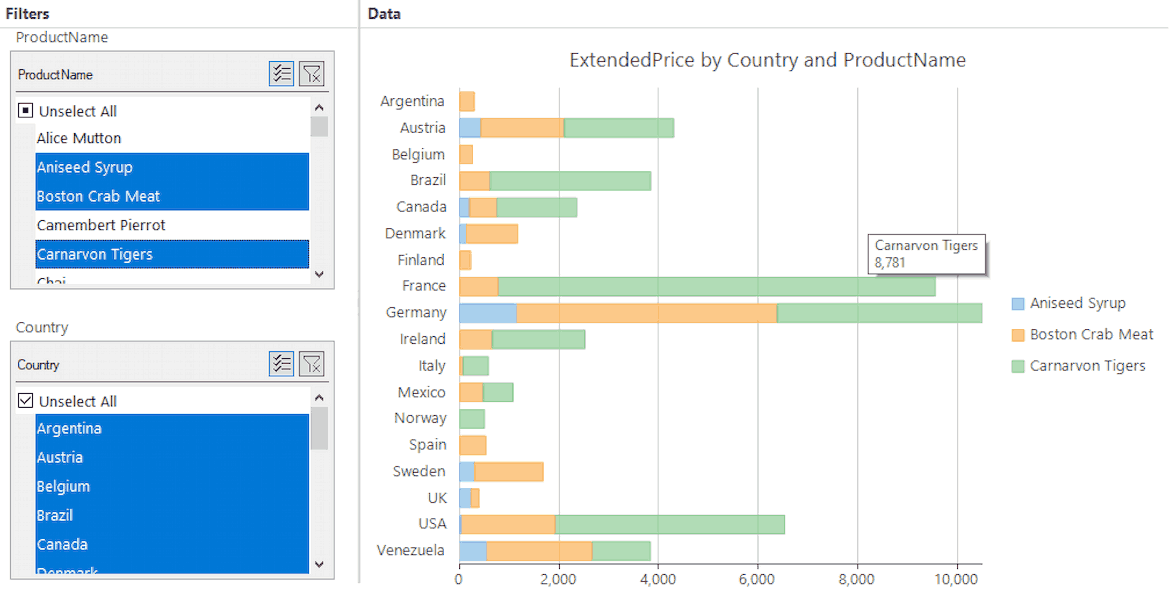
Convey the same pivot table view in a chart to discover new insights and trends. The PivotChart is an extension of FlexChart and supports multiple chart types, like column, bar, area, scatter, and pie, tooltips, legends and hierarchical axes.
Ask anything!
Share your concerns and questions about ComponentOne with MESCIUS's expert team. We empathize with your concerns and are here to help.


FlexPivot Table Demo
Explore all the features and showcase demos of FlexPivot using the Control Explorer application for .NET Framework or .NET 6+ !
ComponentOne Enterprise Free Trial
ComponentOne Enterprise
Expand your development reach across all .NET platforms with ComponentOne Enterprise.