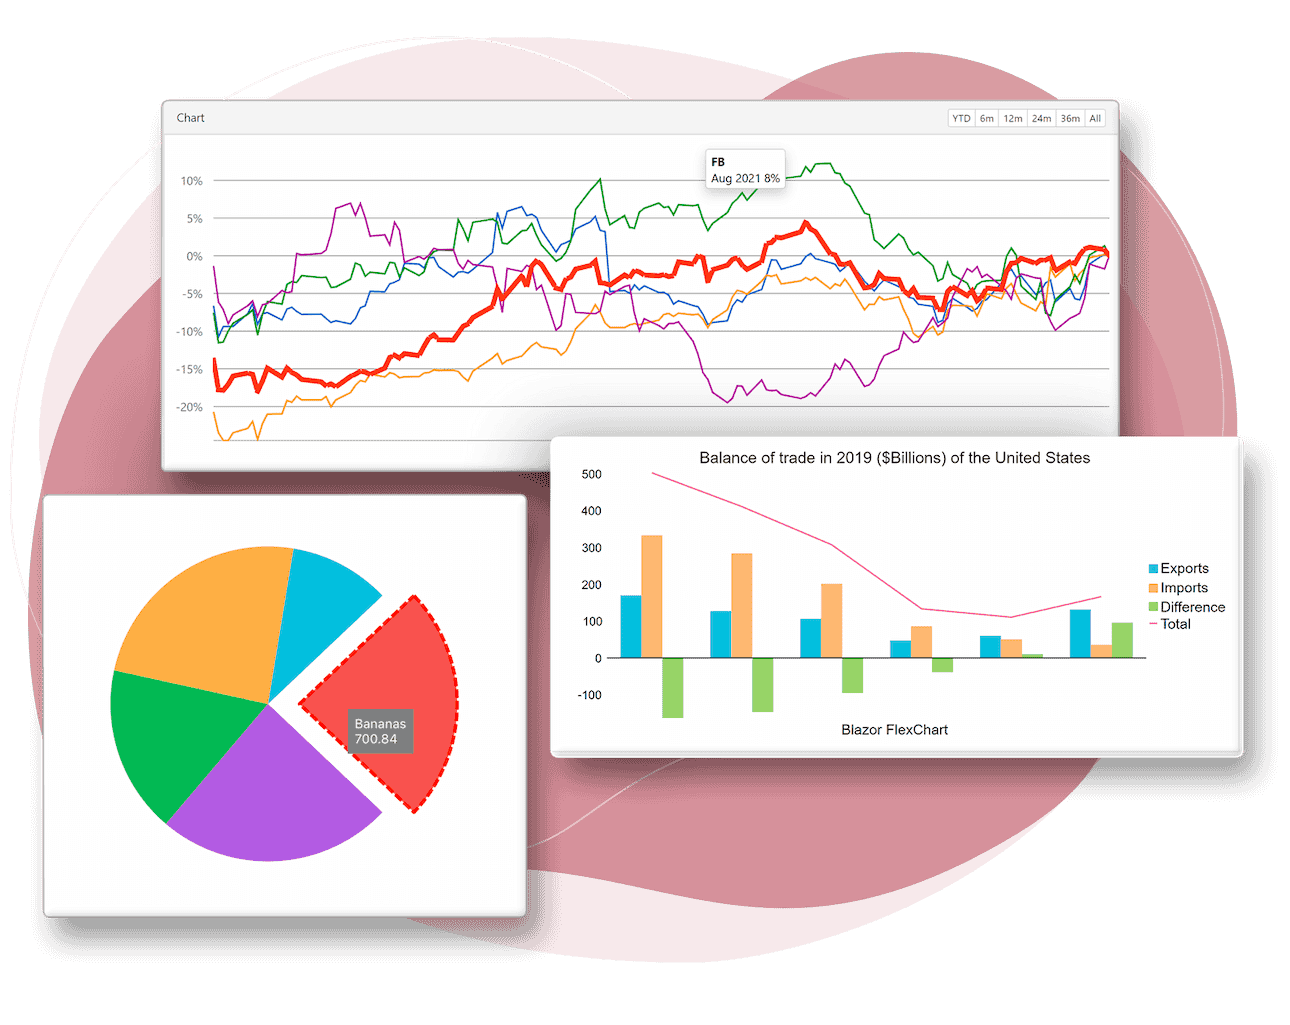
FlexChart
List of Services
Visualize your data with over 100 charts, interactions, and elements for enterprise apps to gain rich insights.
- Desktop: WinForms, WPF, UWP
- Web: ASP.NET MVC, Blazor, Wijmo JavaScript
- Native Mobile: Xamarin
Why Choose FlexChart?

Ask anything!
Share your concerns and questions about ComponentOne with MESCIUS's expert team. We empathize with your concerns and are here to help.
Bar Chart Type
-
Column Charts
A vertical bar chart.
Doc: WinForms| WPF| UWP| ASP.NET MVC| Xamarin| Blazor
ASP.NET MVC Demo -
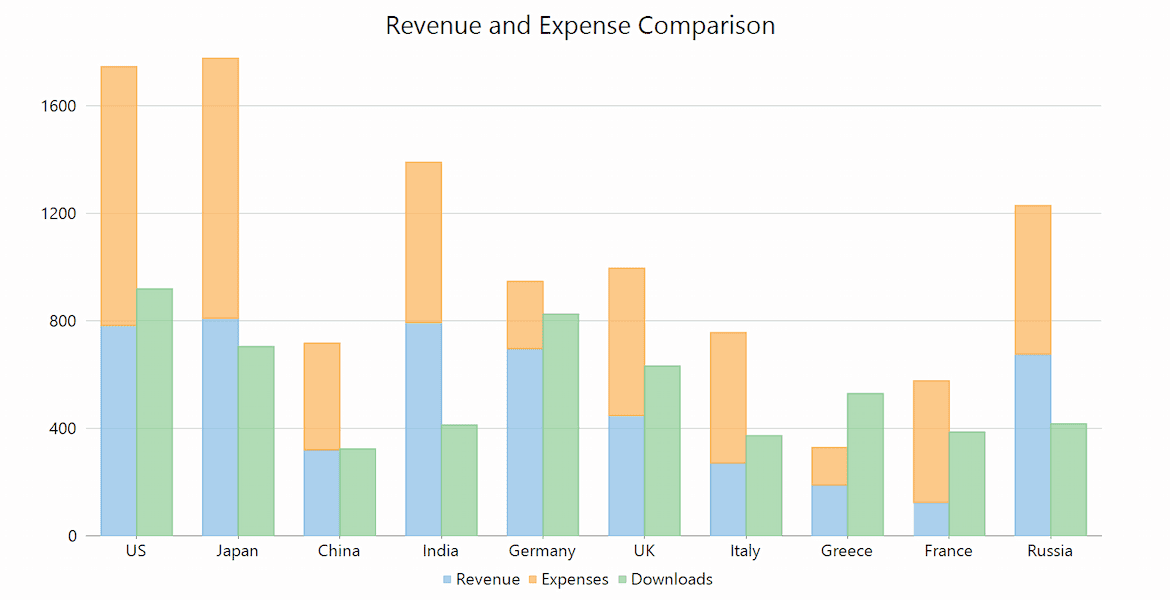
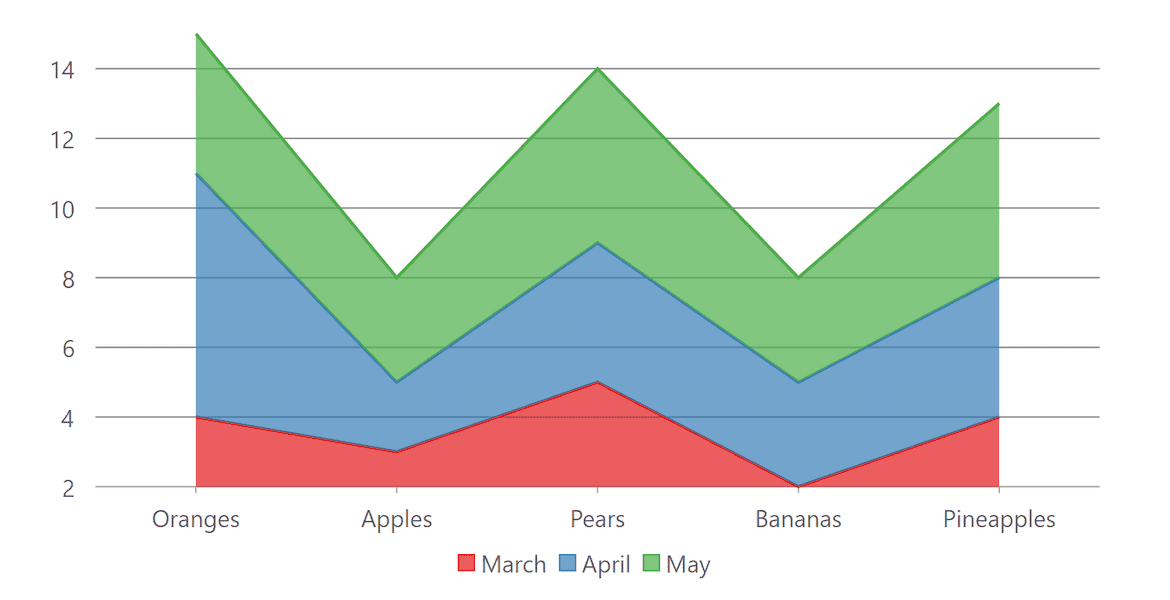
Bar Stacked Charts
Stack data points in a vertical bar chart.
Doc: WinForms| WPF| UWP| ASP.NET MVC| Xamarin| Blazor
ASP.NET MVC Demo -
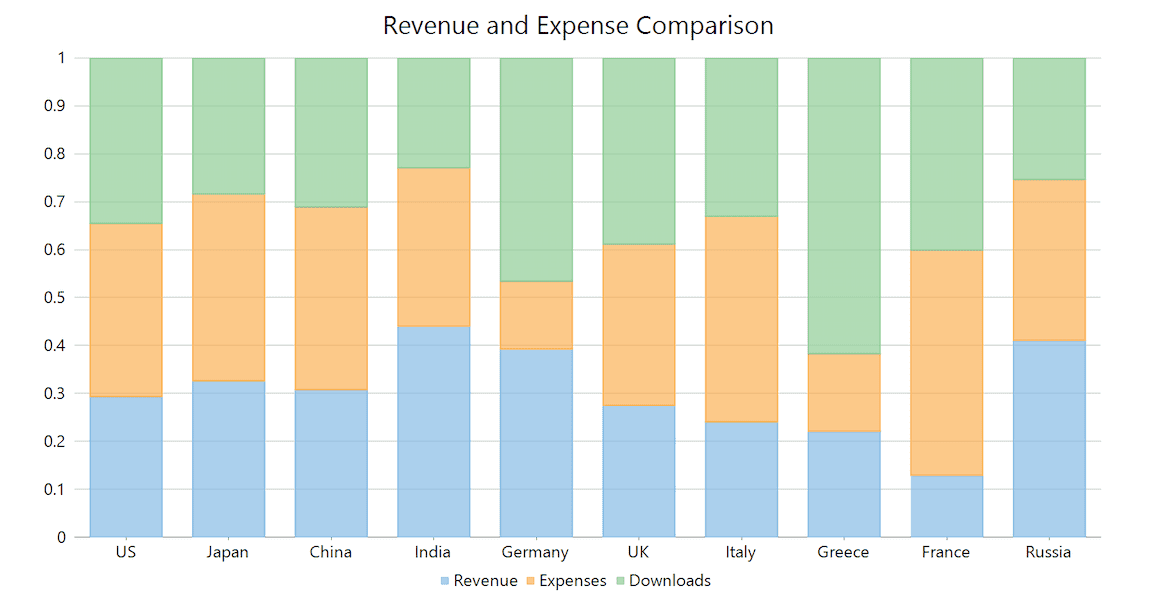
Bar Stacked 100% Charts
Compares the percentage each value contributes to the total.
Doc: WinForms| WPF| UWP| ASP.NET MVC| Xamarin| Blazor
ASP.NET MVC Demo -

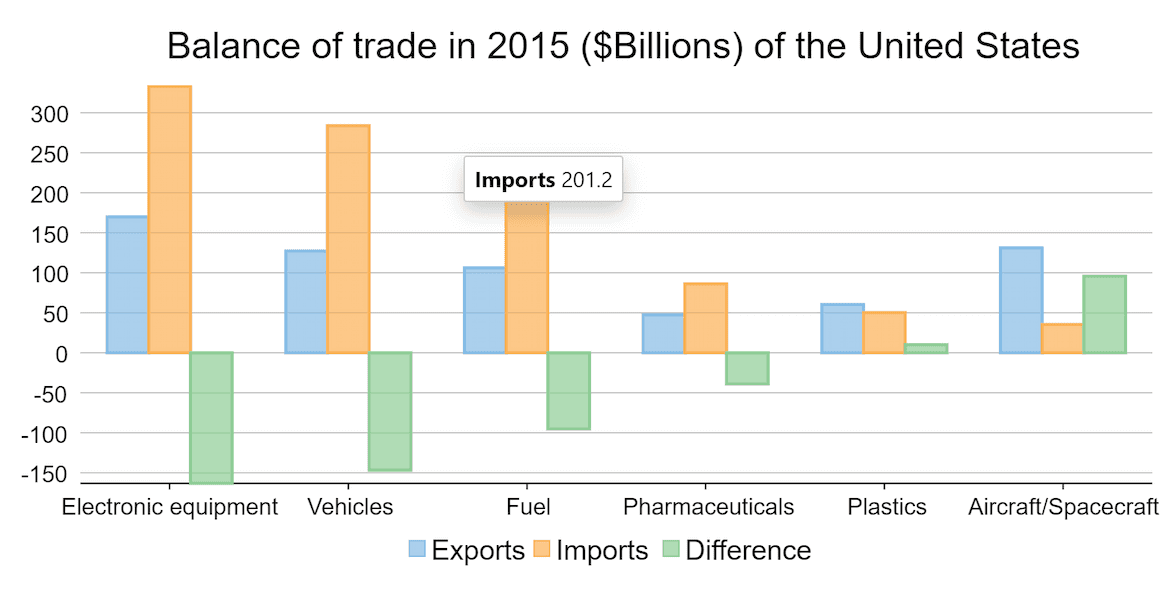
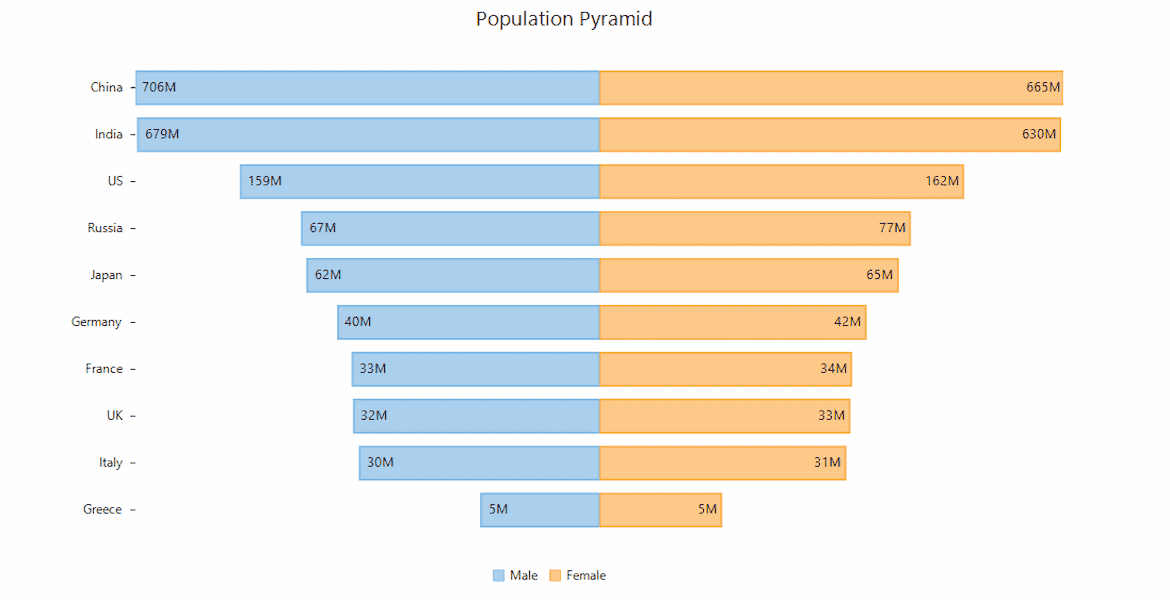
Bar Charts
Compare multiple data series over time in a basic bar chart.
Doc: WinForms| WPF| UWP| ASP.NET MVC| Xamarin| Blazor
ASP.NET MVC Demo 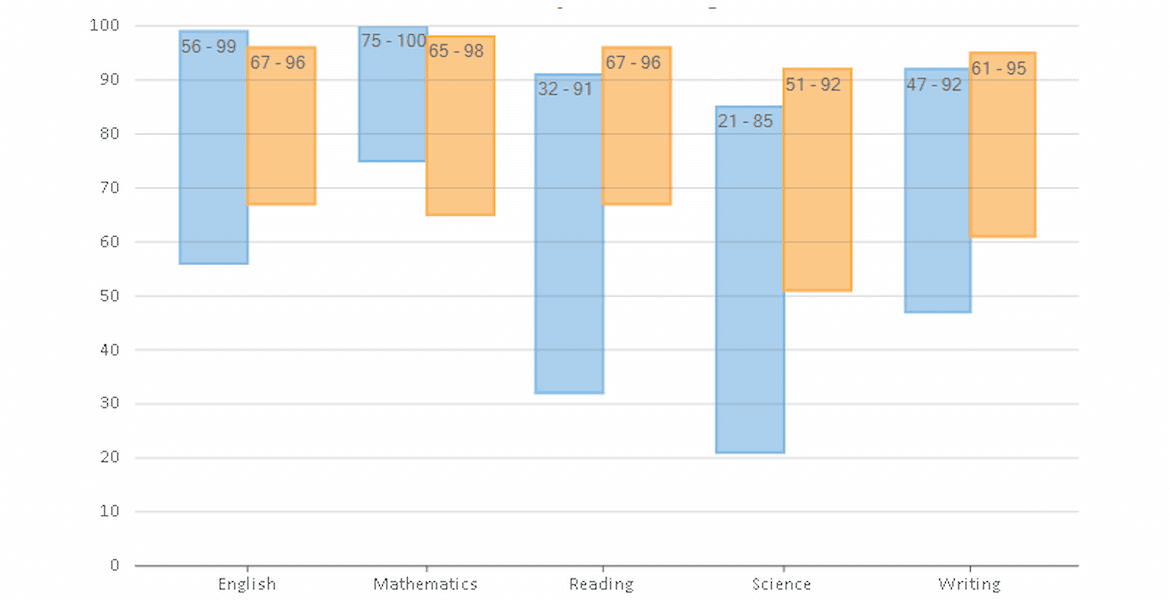
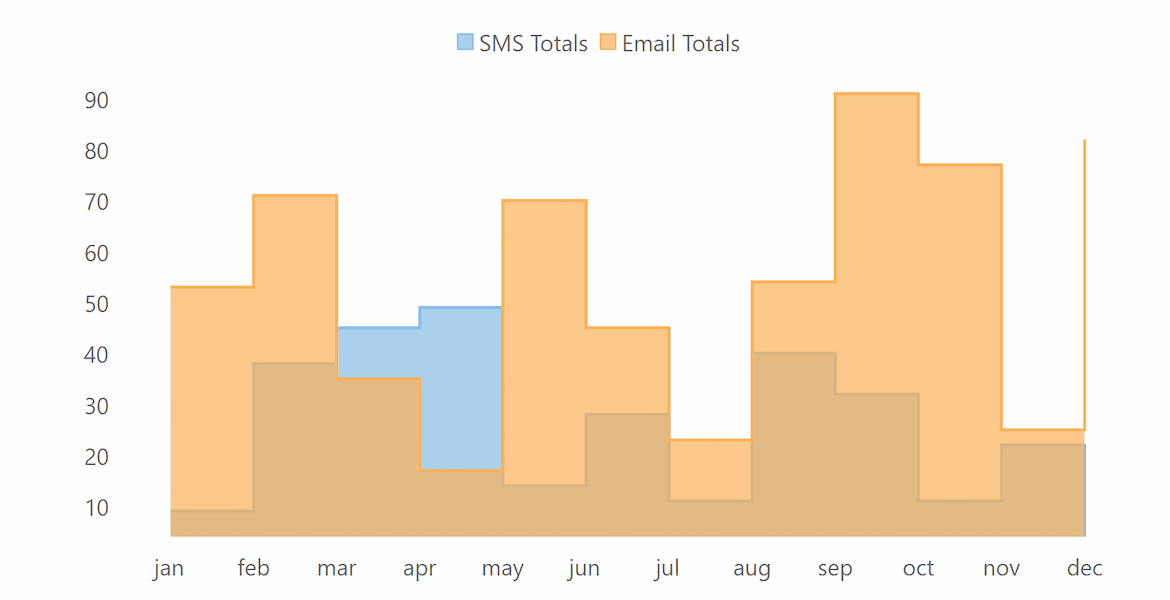
Floating Bar Chart
Displays two values for each column or bar: minimum and maximum.
Doc: WinForms| WPF| UWP| ASP.NET MVC| Blazor
Line and Area Charts
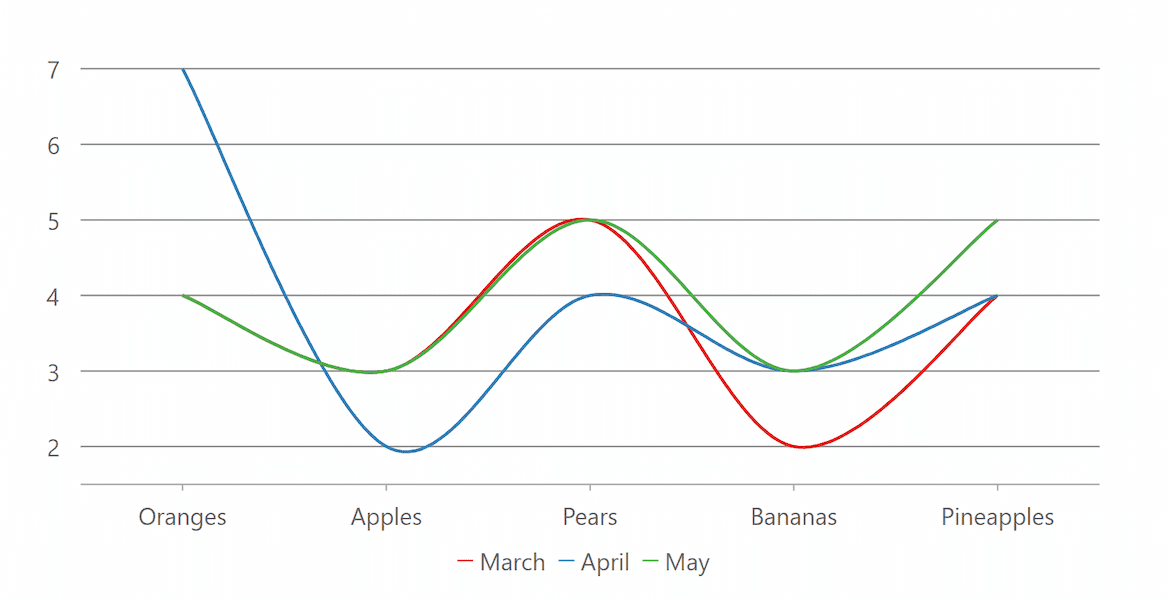
Range Area Charts
Displays changes in data values over a specified period of time.
Doc: WinForms| WPF| UWP| ASP.NET MVC
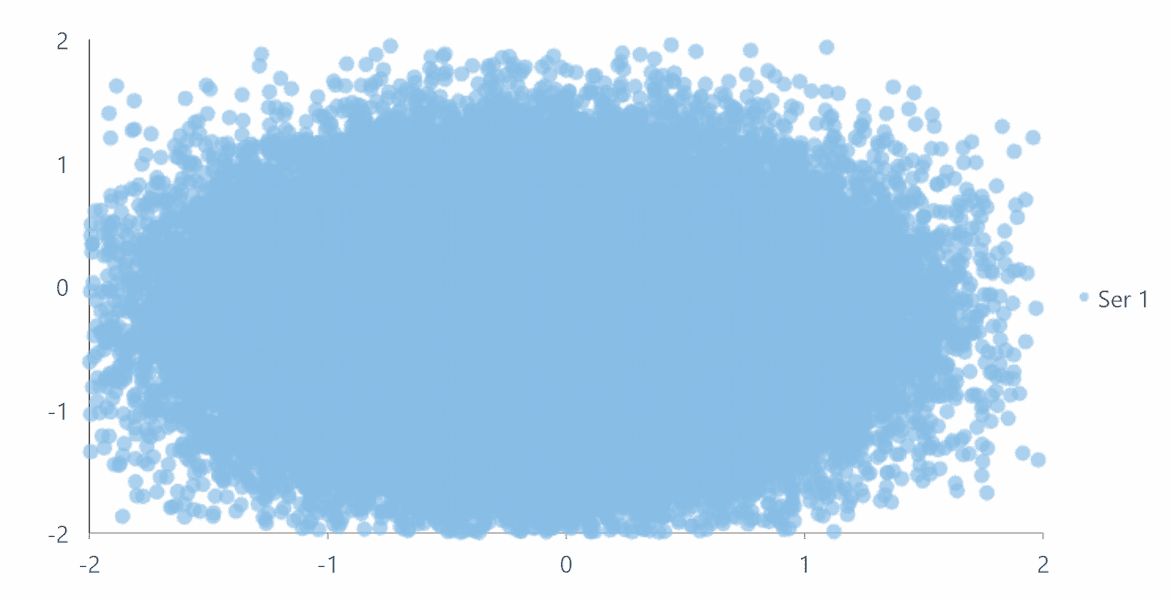
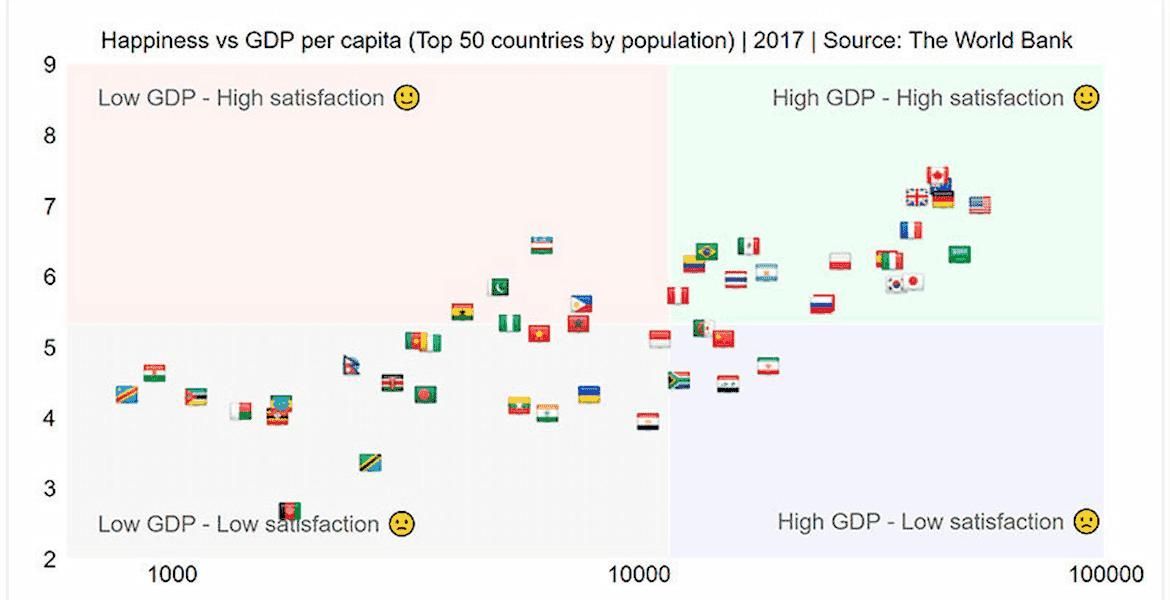
Scatter Chart
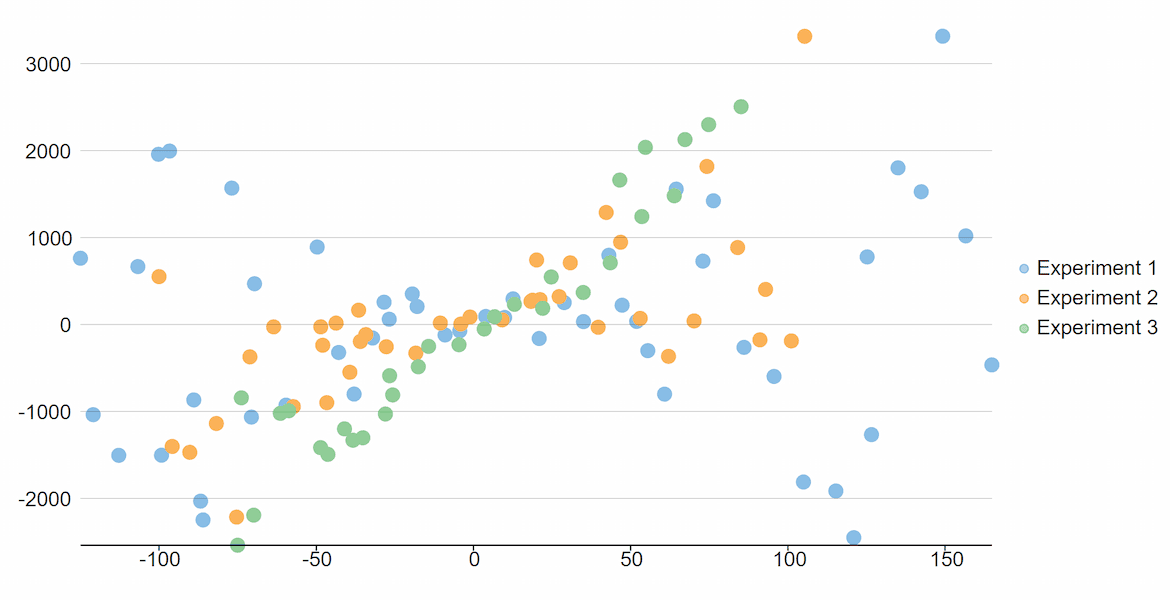
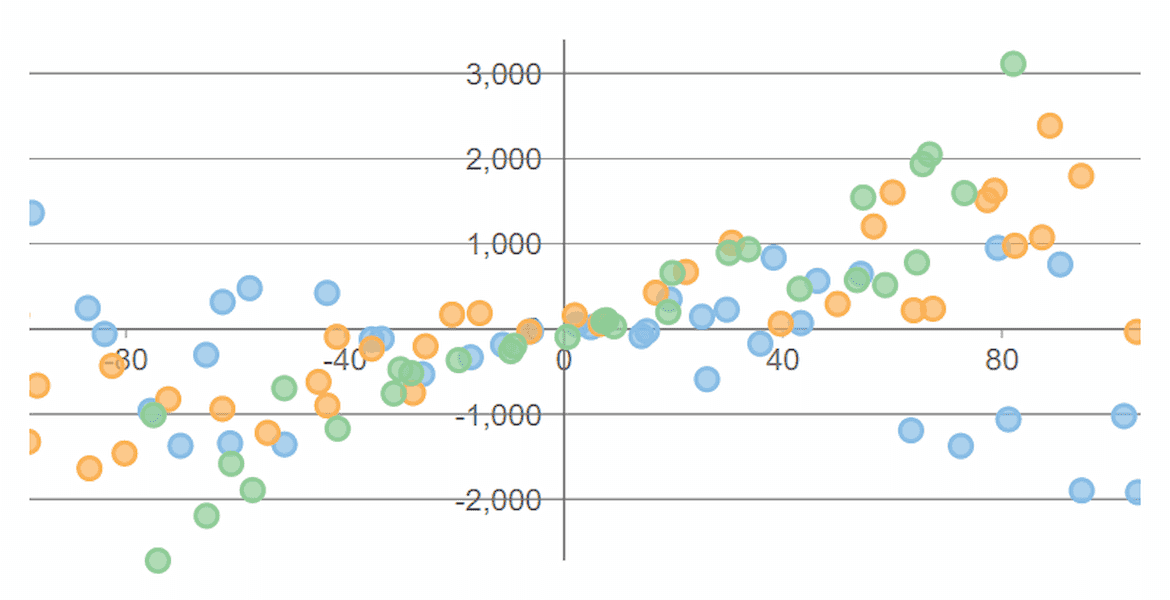
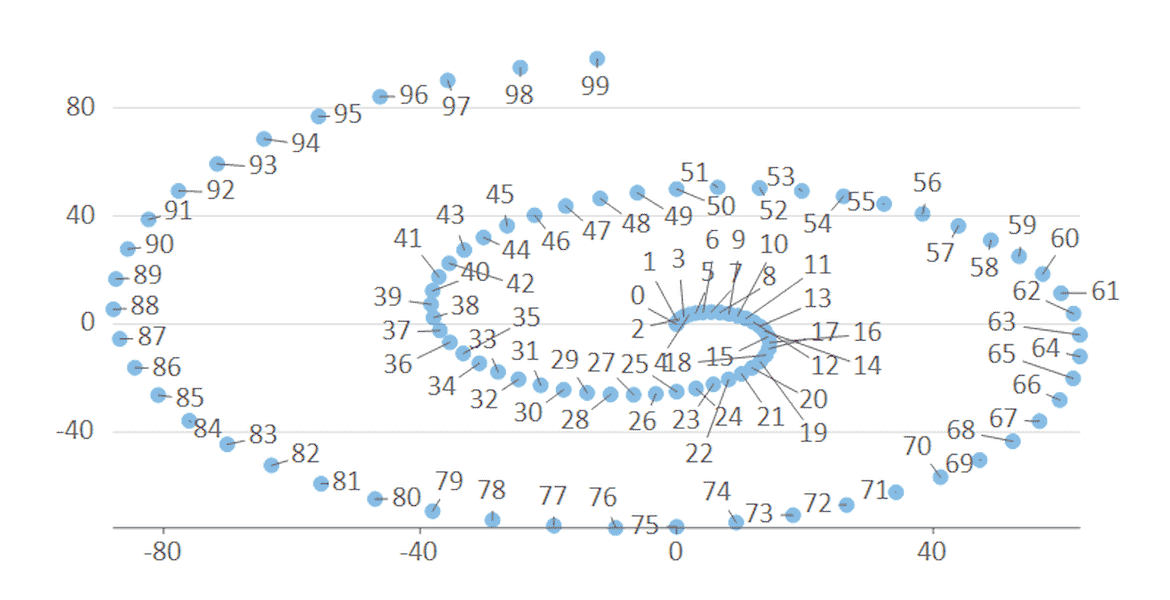
Scatter Chart
A scatter chart displays one set of numeric data along the X-axis and another set of numeric data along the Y-axis, indicating the correlation between data points. Scatter charts combine these values into single data points, displaying them in uneven intervals, or clusters.
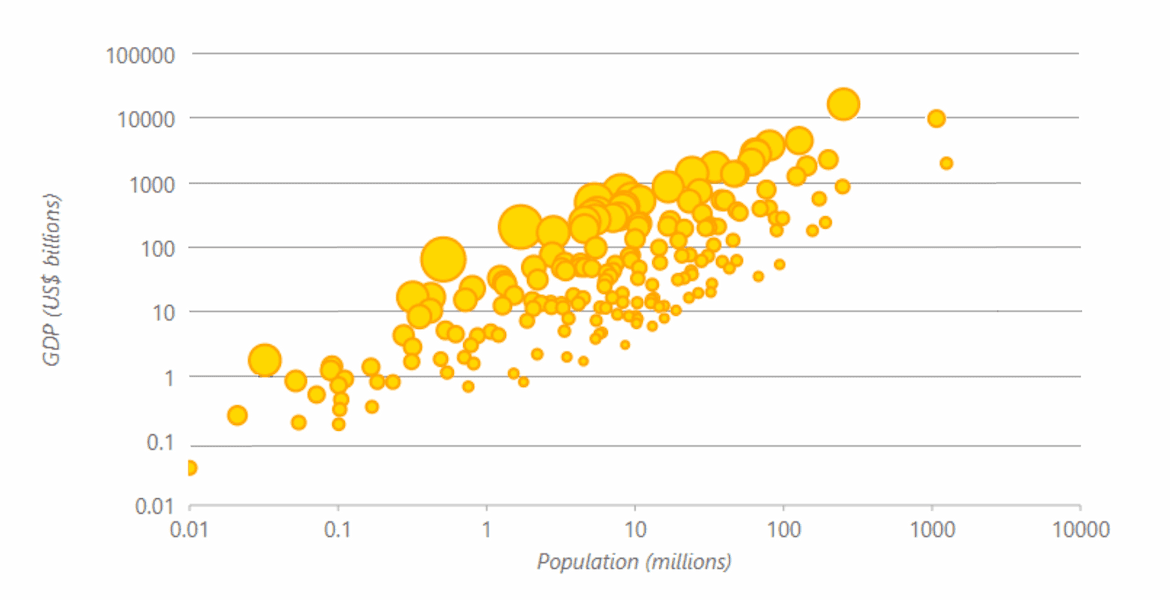
Bubble Chart
Create rich, visually appealing data modeling and financial charts with bubble charts. This chart type allows you to display data series as a series of symbols of varying sizes in the chart space.
C# Financial Chart
-
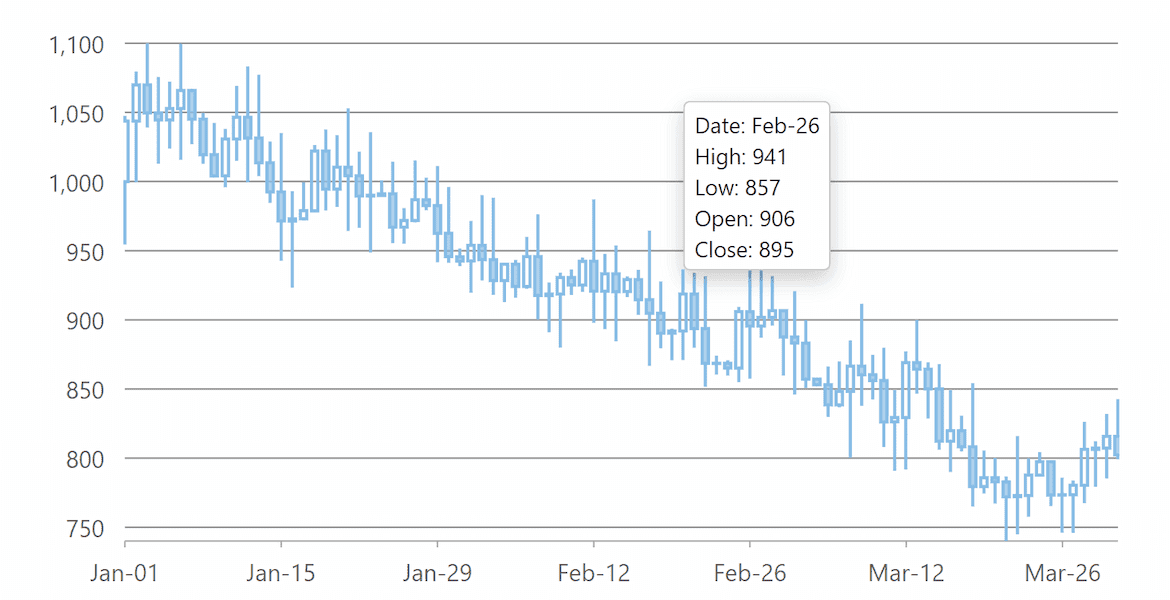
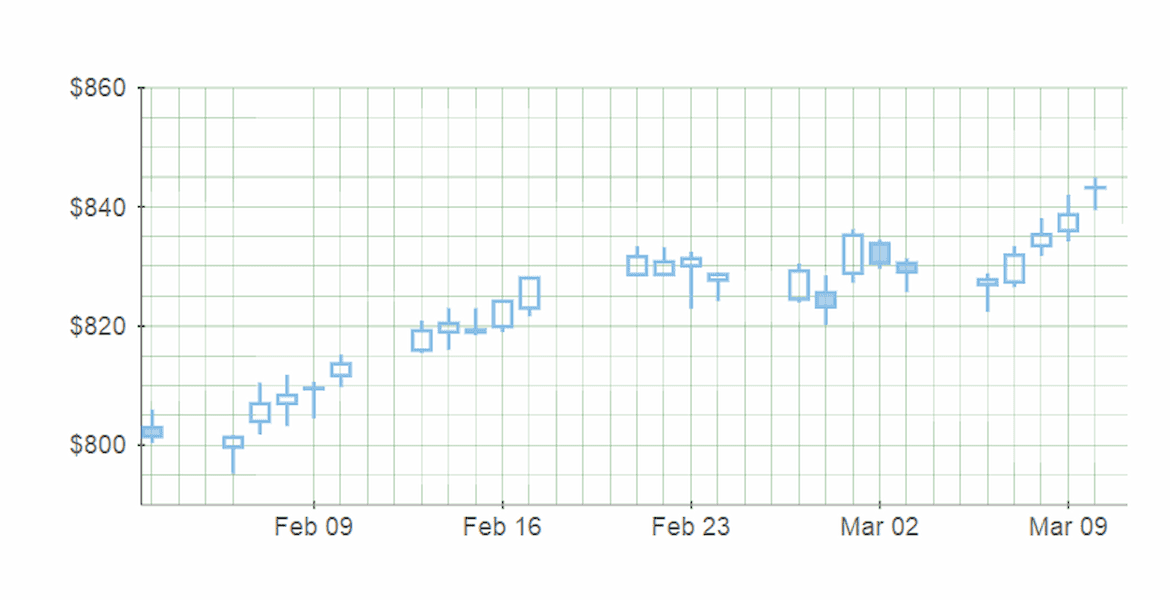
Candlestick Charts
Visualize financial data in a cylinder chart. The series in this chart display the opening, closing, high, and low prices for each day. The vertical bars fill in the highest and lowest prices for that day.
Doc: WinForms| WPF| UWP| ASP.NET MVC| Xamarin| Blazor
ASP.NET MVC Demo -
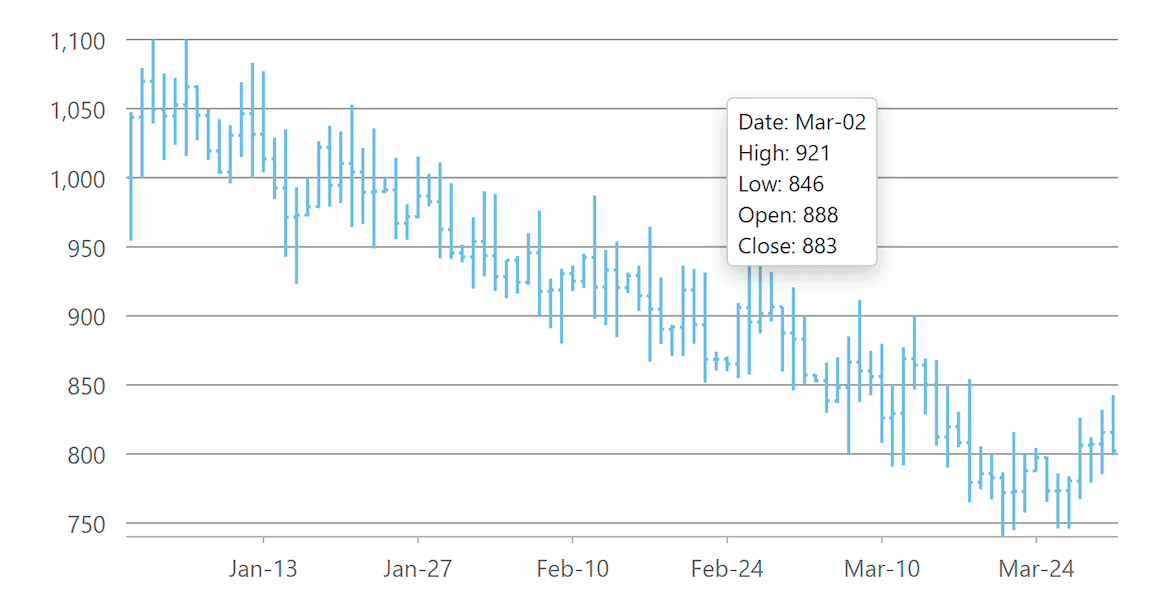
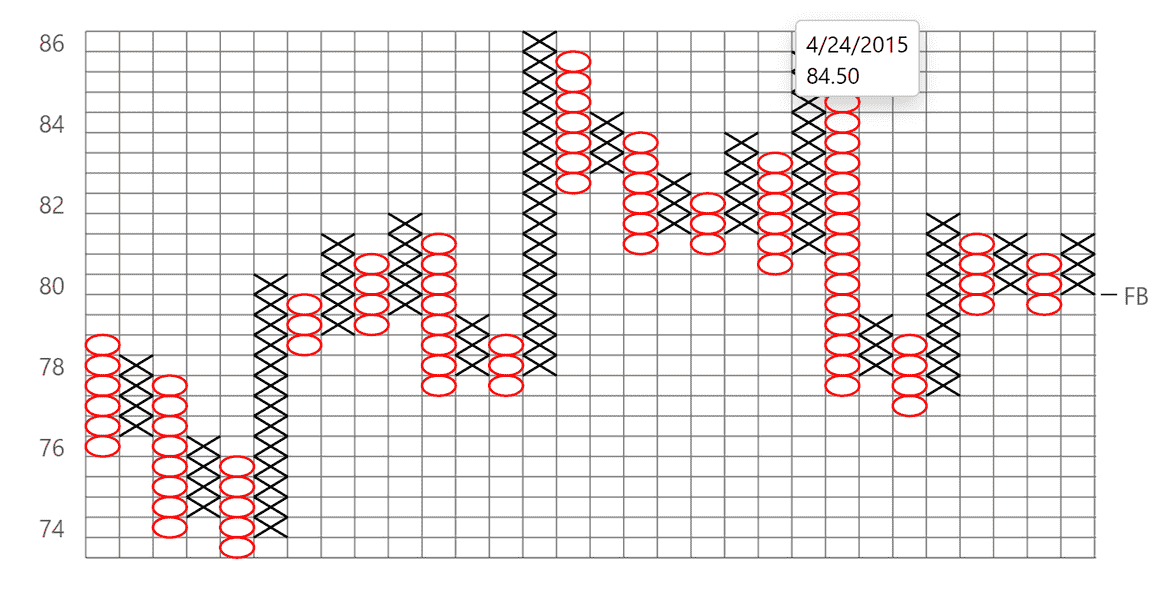
HLOC Charts
HLOC, which stands for High/Low/Opening/Closing, displays the price fluctuations of a financial instrument over time.
Doc: WinForms| WPF| UWP| ASP.NET MVC| Xamarin| Blazor
ASP.NET MVC Demo -
More Financial Charts
ComponentOne Enterprise includes the FinancialChart control, which contains nine specialized financial charts.
See More Details
Pie and Sunburst Charts
-
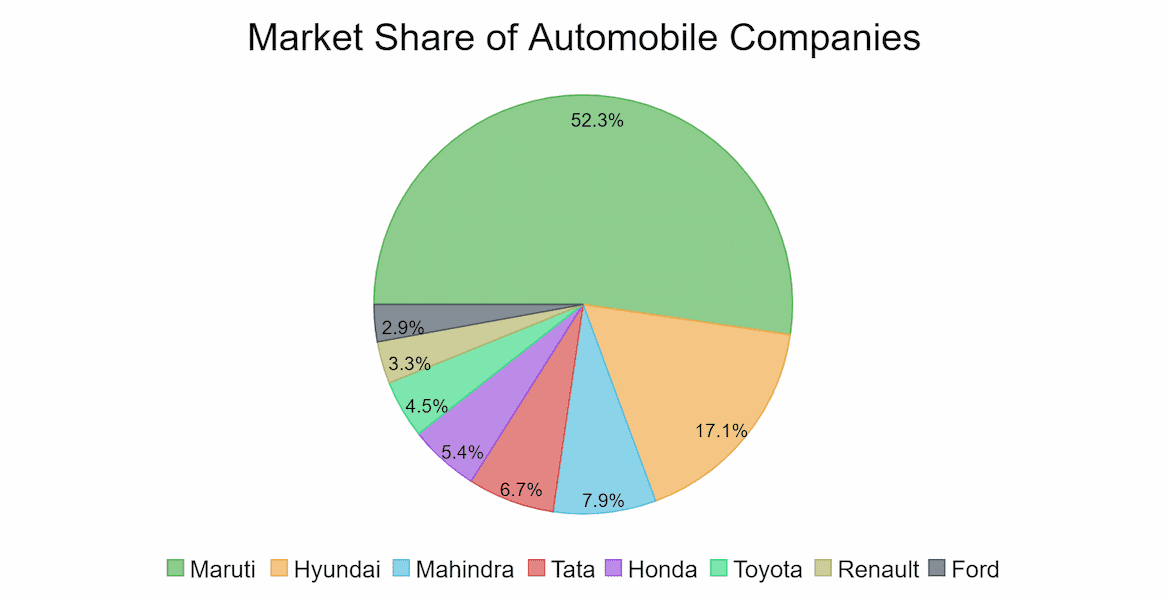
Pie Charts
C# pie charts show how parts of a whole add up to 100%. FlexPie features include doughnut, exploded slices, animation, selection, and rotation.
Doc: WinForms| WPF| UWP| ASP.NET MVC| Xamarin| Blazor
ASP.NET MVC Demo -
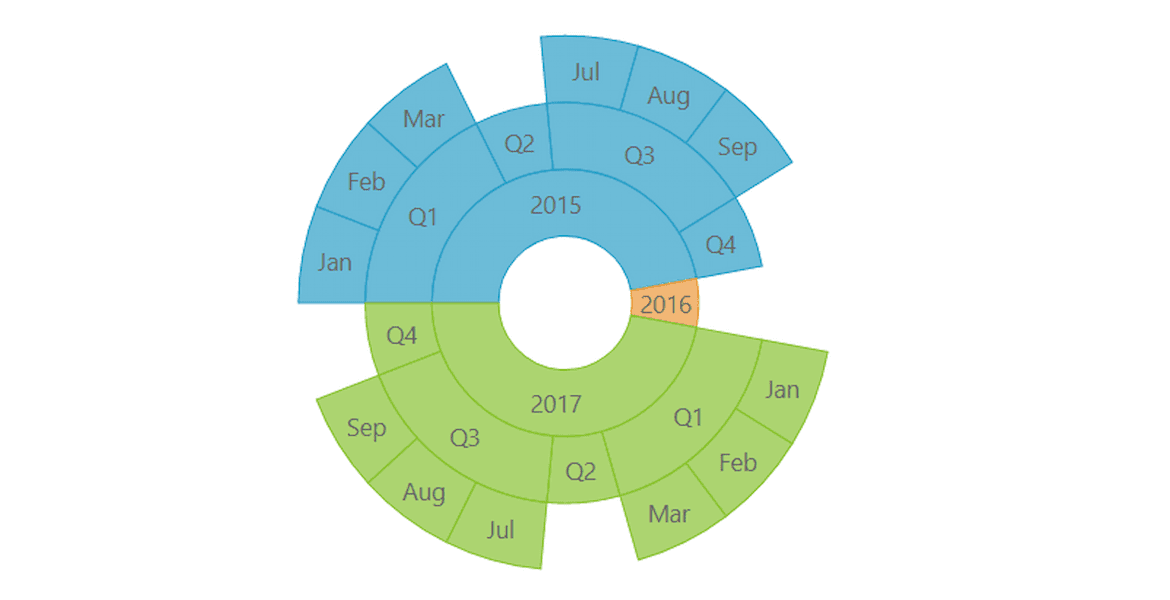
Sunburst Charts
Visualize hierarchical data from a root node (center) outward to lower hierarchies. A segment of the inner circle is a parent to the segments of the outer circle which lie within the angular sweep of a parent.
Doc: WinForms| WPF| UWP| ASP.NET MVC| Xamarin| Blazor
ASP.NET MVC Demo 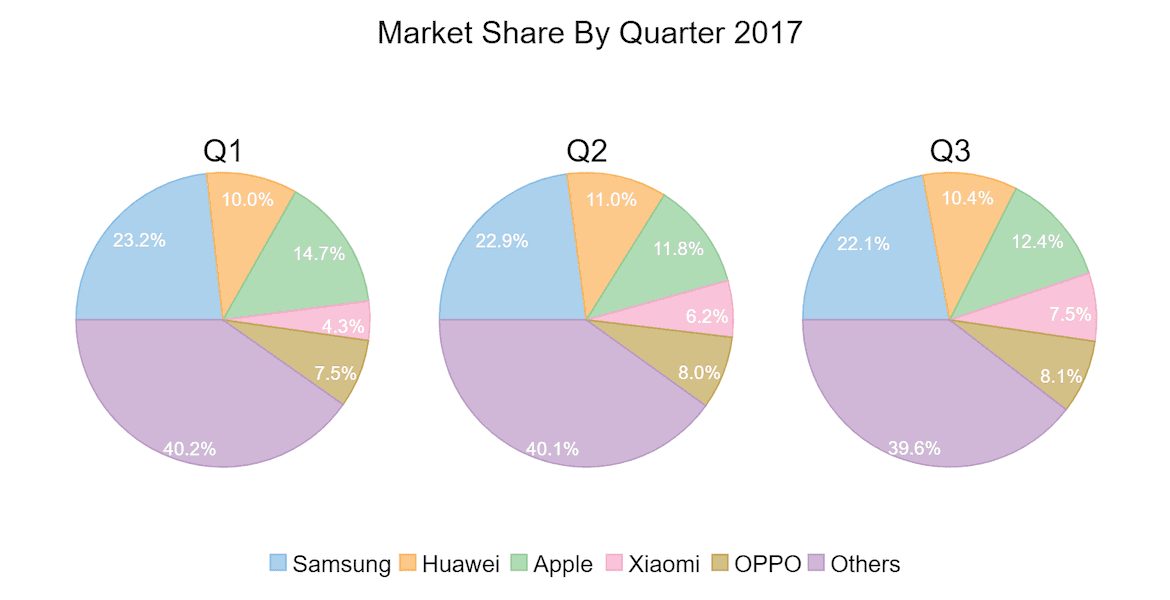
Multiple Pie Charts
Use FlexPie to visualize more data in a single chart by creating multiple pie chart "series" using the same data source. An effective way of presenting data, especially if the intent is to show one section relative to the whole.
Doc: WinForms| WPF| UWP| ASP.NET MVC
Radial & Polar Charts
-
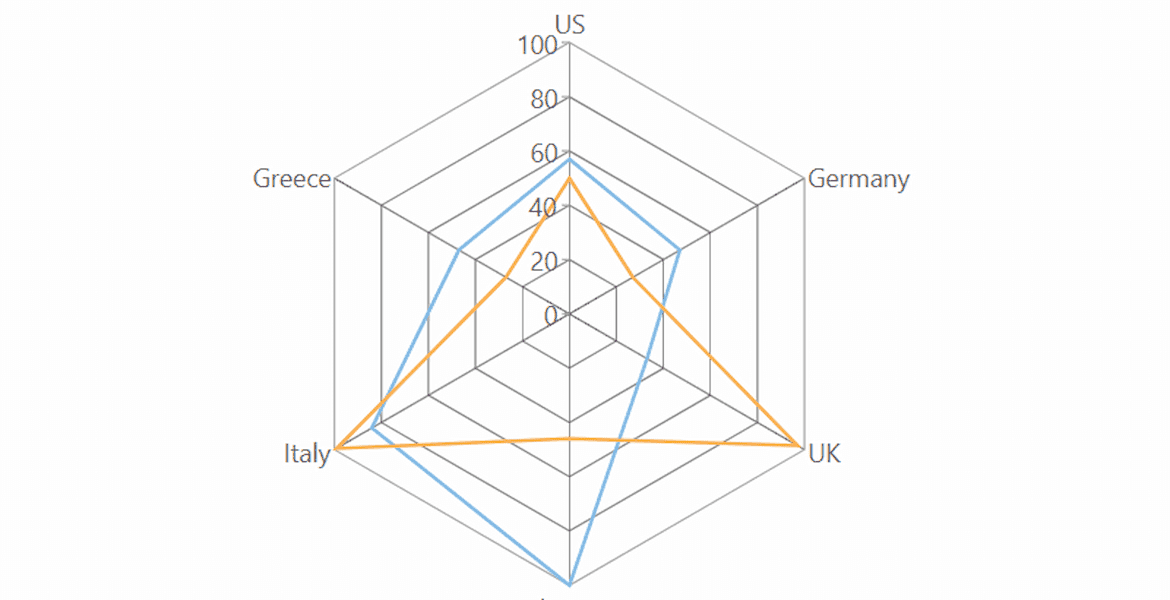
Radar Charts
Display multivariate observations with an arbitrary number of variables. FlexRadar supports line, area, column, scatter and stacked chart types.
Doc: WinForms| WPF| UWP| ASP.NET MVC| Blazor
ASP.NET MVC Demo -
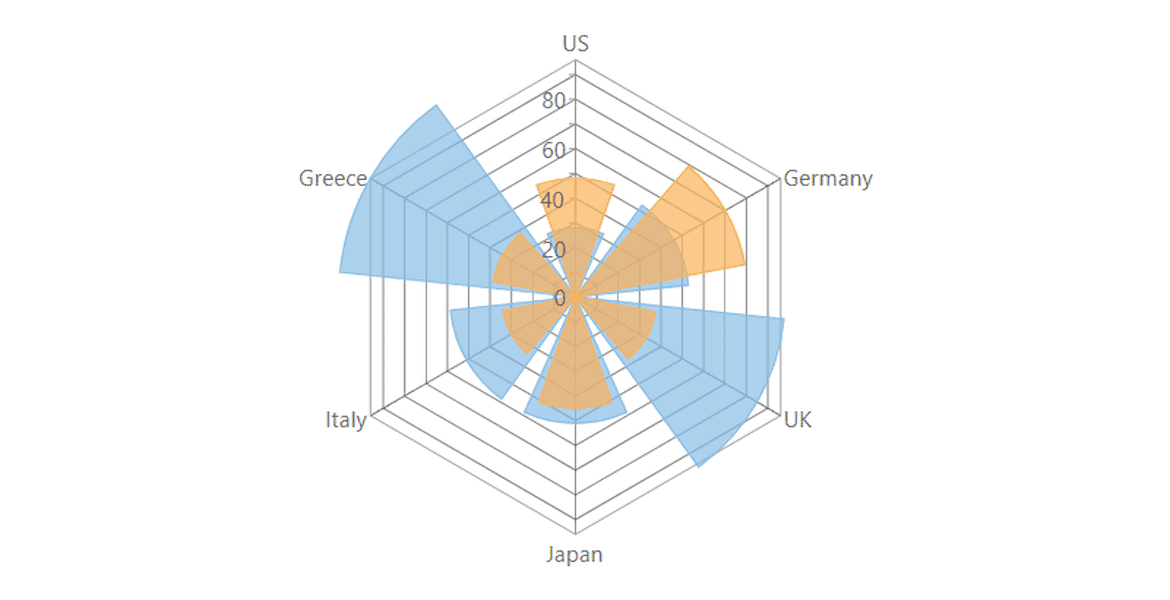
Radar Column Charts
Create a windrose chart using FlexRadar and the Column chart type. This visualization lets you display changes in the radar through radiating columns with stacking support.
Doc: WinForms| WPF| UWP| ASP.NET MVC| Blazor
ASP.NET MVC Demo -
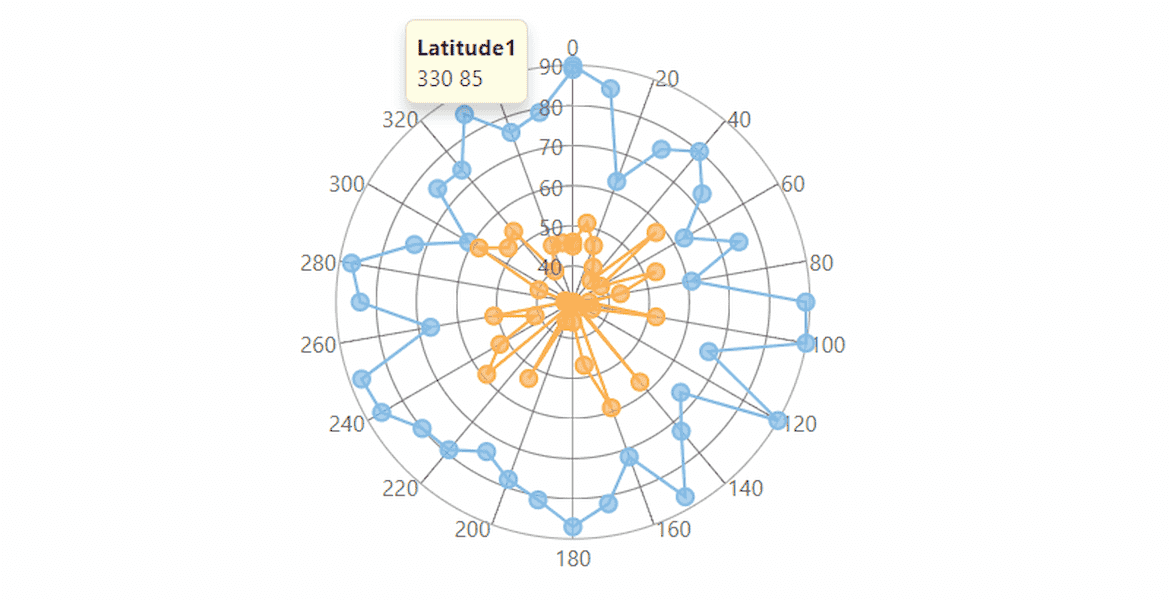
Polar Charts
Create circular graphs to display multivariate observations with an arbitrary number of variables. FlexRadar can generate polar charts with lines, columns, filled areas and custom symbols.
Doc: WinForms| WPF| UWP| ASP.NET MVC| Blazor
ASP.NET MVC Demo
Special C# Charts
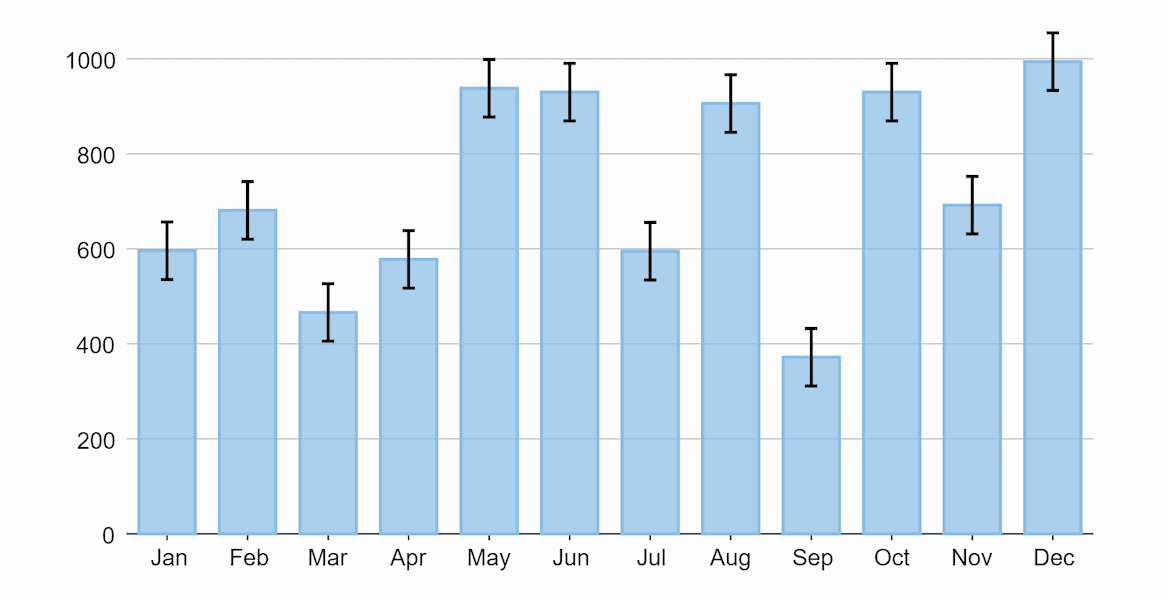
Error Bar Charts
Error bars help you see margins of error and standard deviations at a glance. They can be shown as a standard error amount, a percentage, or a standard deviation.
WinForms| WPF| UWP| ASP.NET MVC| Blazor
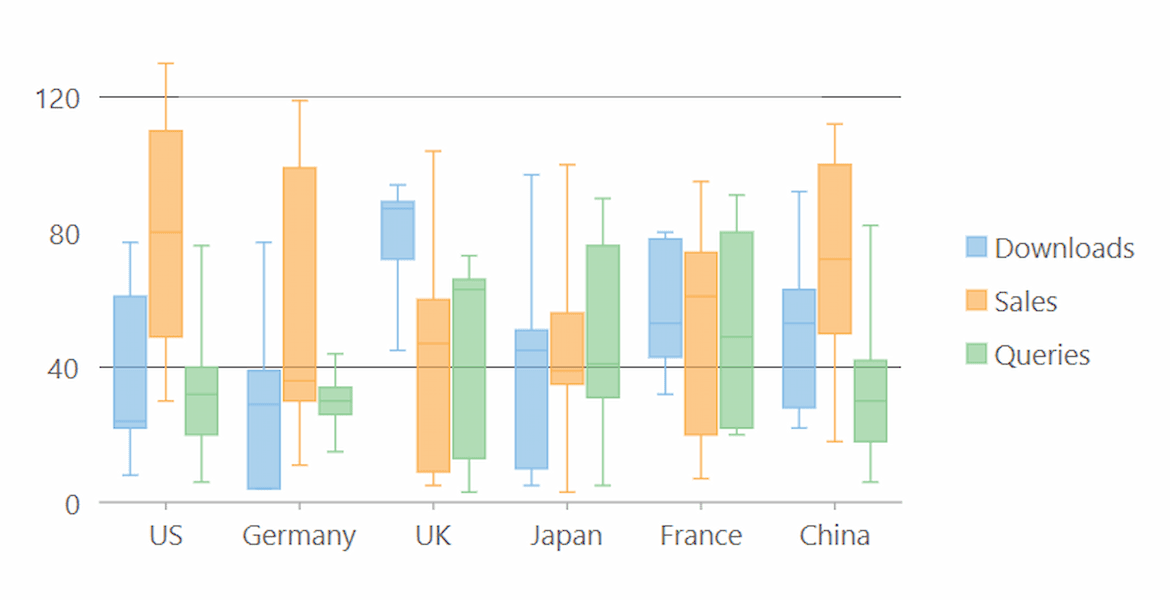
Box-and-Whisker Charts
Graphically depict groups of numerical data through their quartile, mean, median and outliers.
WinForms| WPF| UWP| ASP.NET MVC| Blazor
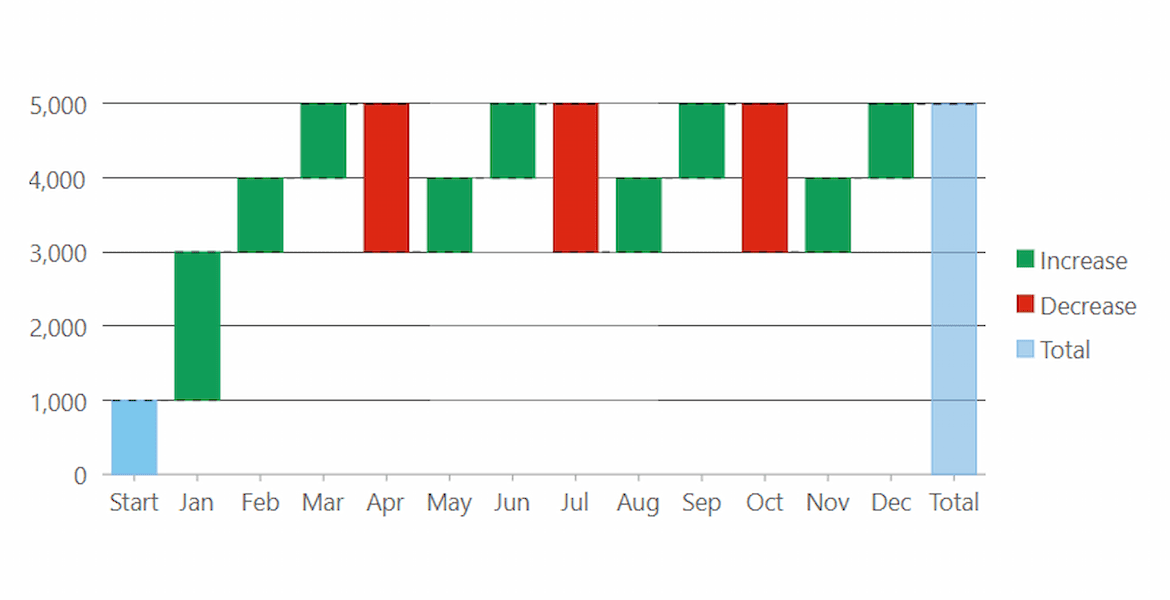
Waterfall Charts
A waterfall chart helps understand the cumulative effect of sequentially introduced positive or negative values. Optionally, display auto-calculated intermediate totals in the waterfall chart.
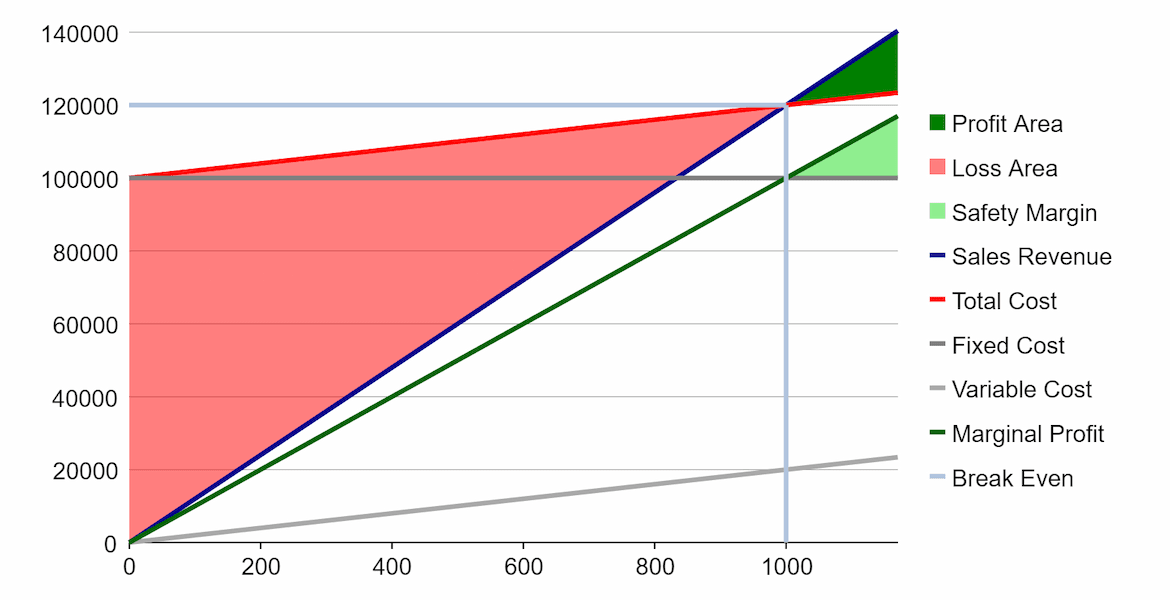
BreakEven Charts
A break-even chart shows the sales volume level at which total costs equal sales. The chart plots revenue, fixed costs, and variable costs on the vertical axis, and volume on the horizontal axis.
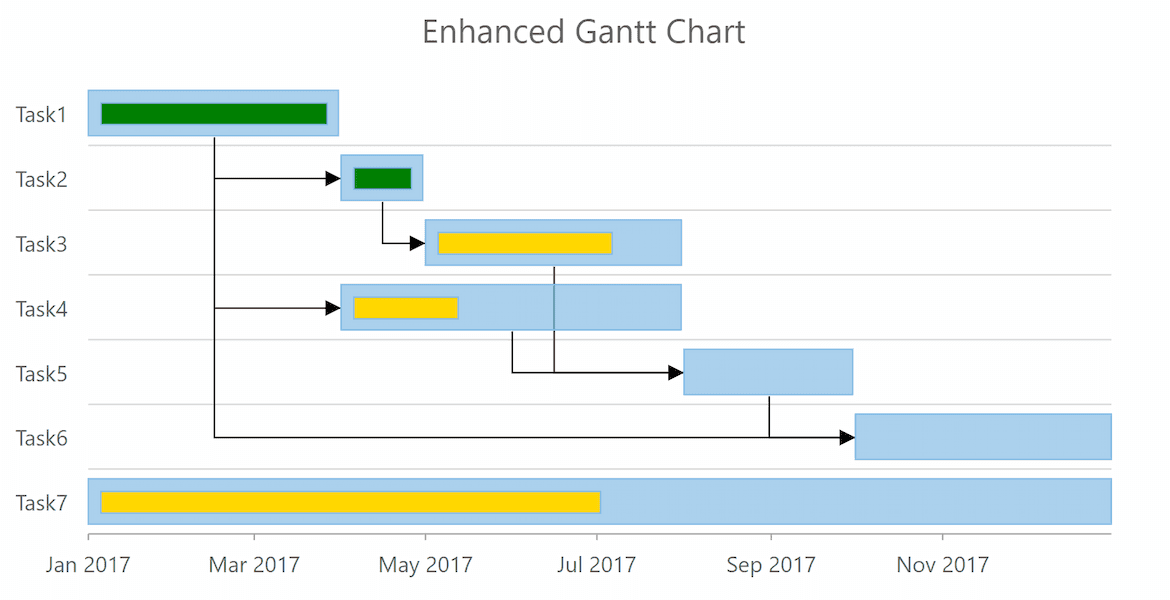
Gantt Charts
Samples are provided for WinForms, WPF, UWP, and ASP.NET MVC.
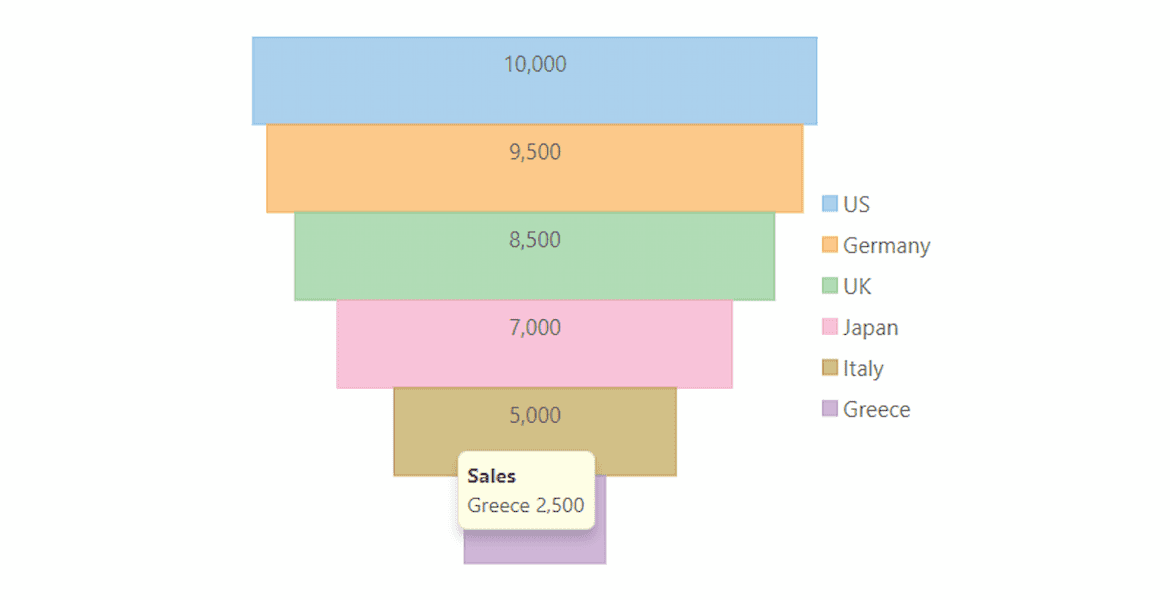
Funnel Charts
Visualize stages of a process, such as a sales funnel, using a funnel shape. Supports triangular or rectangular shape.
WinForms| WPF| UWP| ASP.NET MVC| Blazor
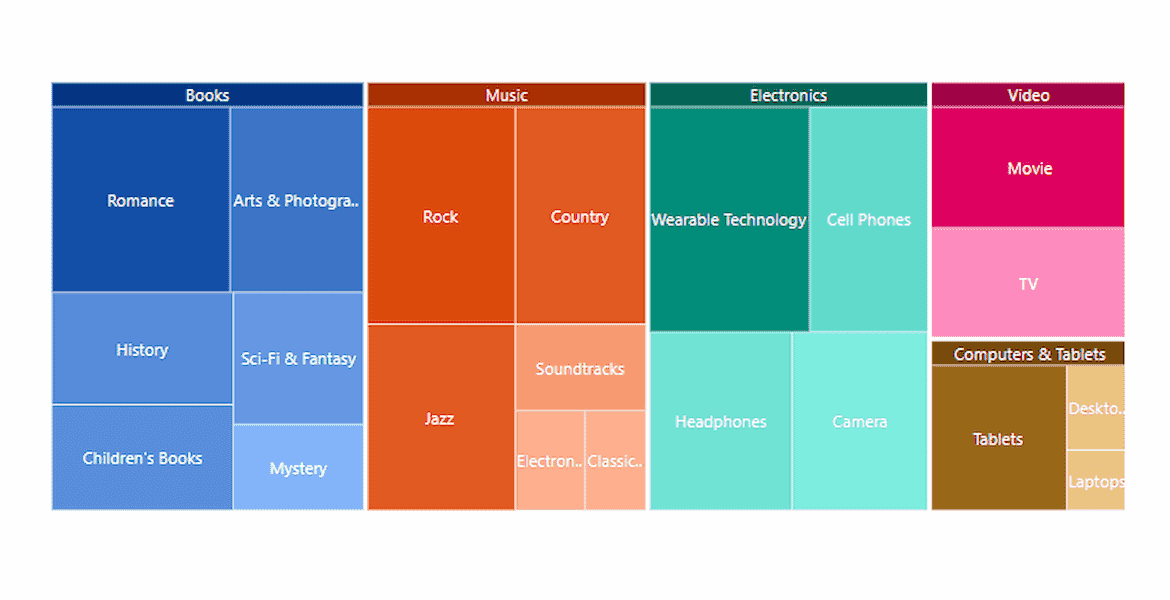
TreeMap Charts
Display hierarchical information combined with relative quantity. Highlight hierarchical, tree-structured data as a set of nested rectangles and help to analyze the anomalies in the data set.
WinForms| WPF| UWP| ASP.NET MVC| Blazor
High-Performance Rendering
For the fastest performance, FlexChart supports DirectX on desktop and WebGL rendering in the browser. Or, you may use the default GDI+ or SVG rendering for full feature support.
Doc: WinForms | WPF | UWP | ASP.NET MVC
interaction
-

Zoom & Pan
Interact with the chart using mouse or tap gestures. Use pinch gesture, mouse wheel or double click to zoom in/out.
WinForms| WPF| UWP| ASP.NET MVC| Xamarin
ASP.NET MVC Demo -
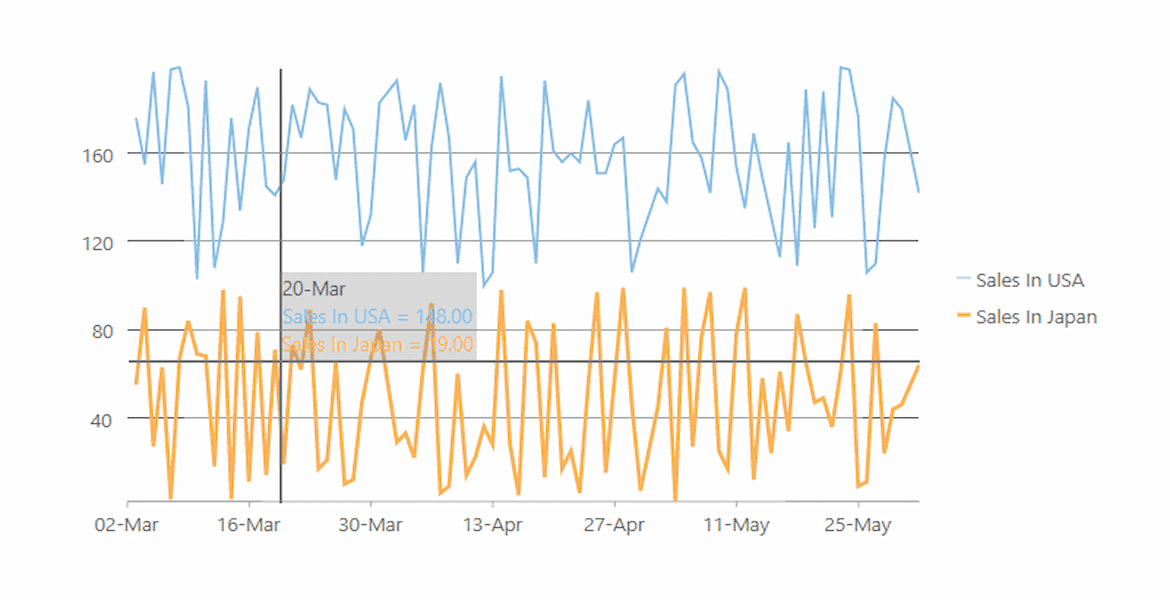
Line Markers
Add interactive line markers or cross-hairs to show information about a specific point on your chart.
WinForms| WPF| UWP| ASP.NET MVC| Xamarin| Blazor
ASP.NET MVC Demo 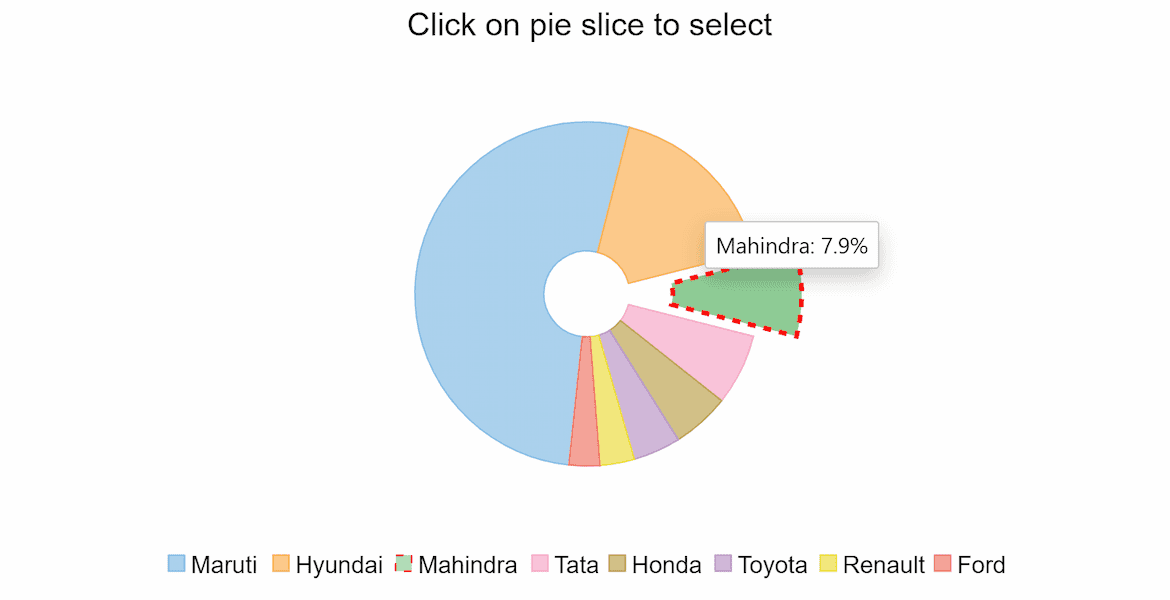
C# Chart Style Features
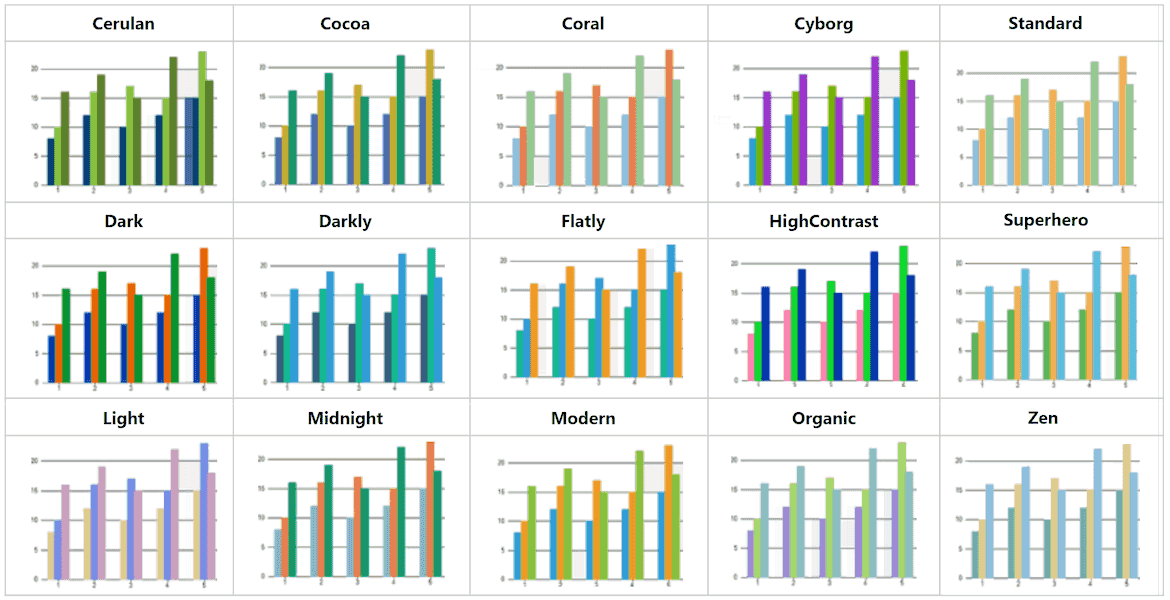
Color Palettes
Quickly choose one of FlexChart's 20 built-in color palettes including sequential, diverging and qualifying palettes which are helpful in visualizing ordered or diverging data sets. Or customize your own palette with full opacity and gradient support.
-

-
C# Chart Axis Features
-
Scaling & Scrolling
FlexChart allows you to add axis scrollbars to the X and Y axes, allowing the user to simultaneously scroll and scale the axis to better visualize the data. This feature is supported on desktop and Blazor.
-
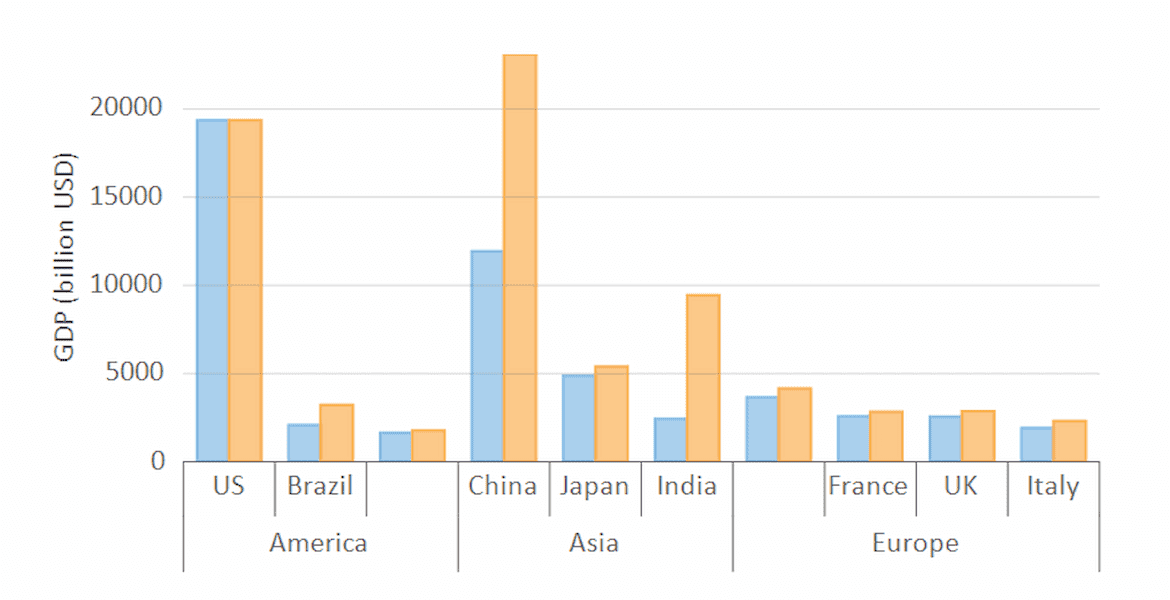
Axis grouping
Improve chart readability by displaying hierarchical groups in axis labels. Avoid overlapping by wrapping labels to a second row or rotating the angle.
-
Axis Breaks
Create presentation-worthy charts by adding axis breaks to make charts with very large gaps more readable for users.
C# Chart Legend Features
-
Legend Grouping
Legends represent the mapping between colors, symbols, and data series on a chart. Grouping the legend items helps organize the data.
-
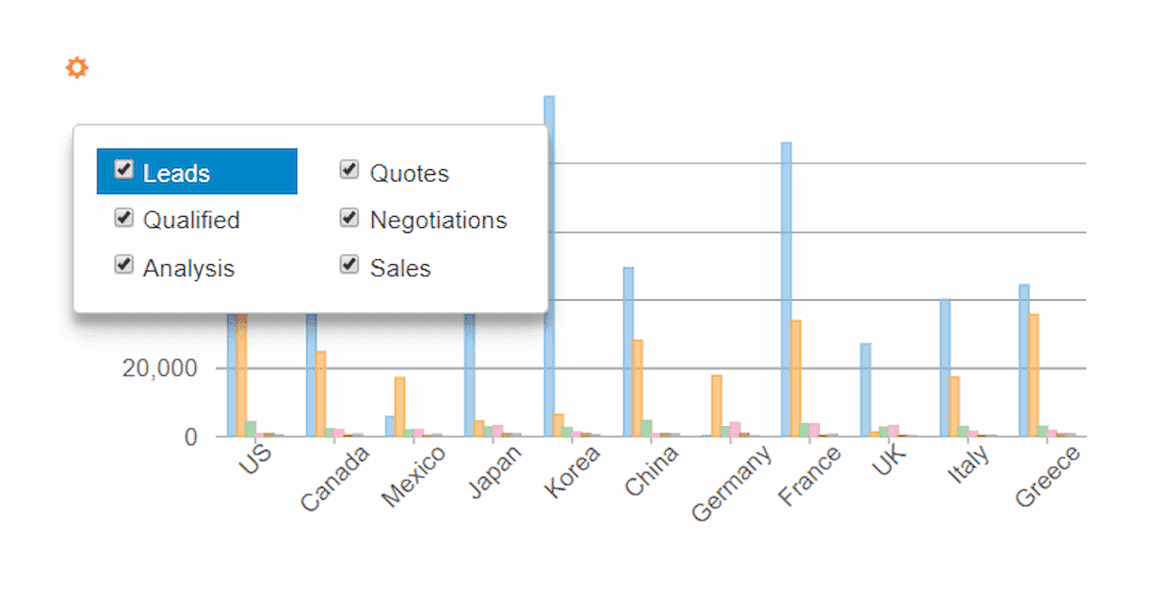
Legend toggle
Allow users to toggle the visibility of series through the legend. This feature is toggled on or off by setting one property on FlexChart.
-
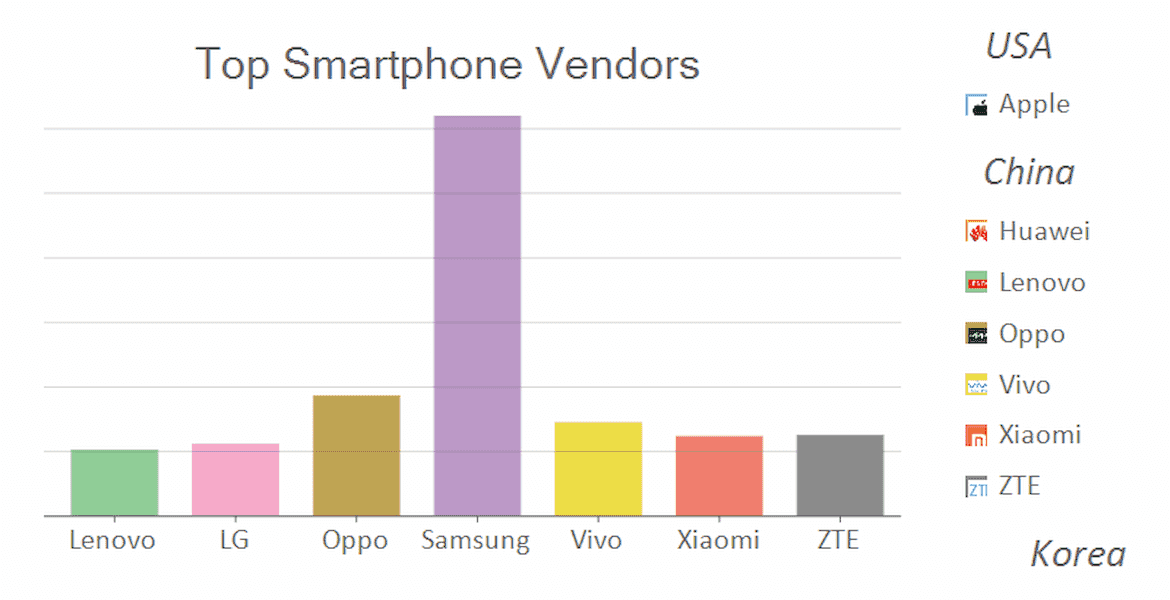
Custom Legend
Further customize the legend with scrolling or custom icons.
WinForms| WPF| UWP| ASP.NET MVC| Xamarin
Ask anything!
Share your concerns and questions about ComponentOne with MESCIUS's expert team. We empathize with your concerns and are here to help.
Additional features
-
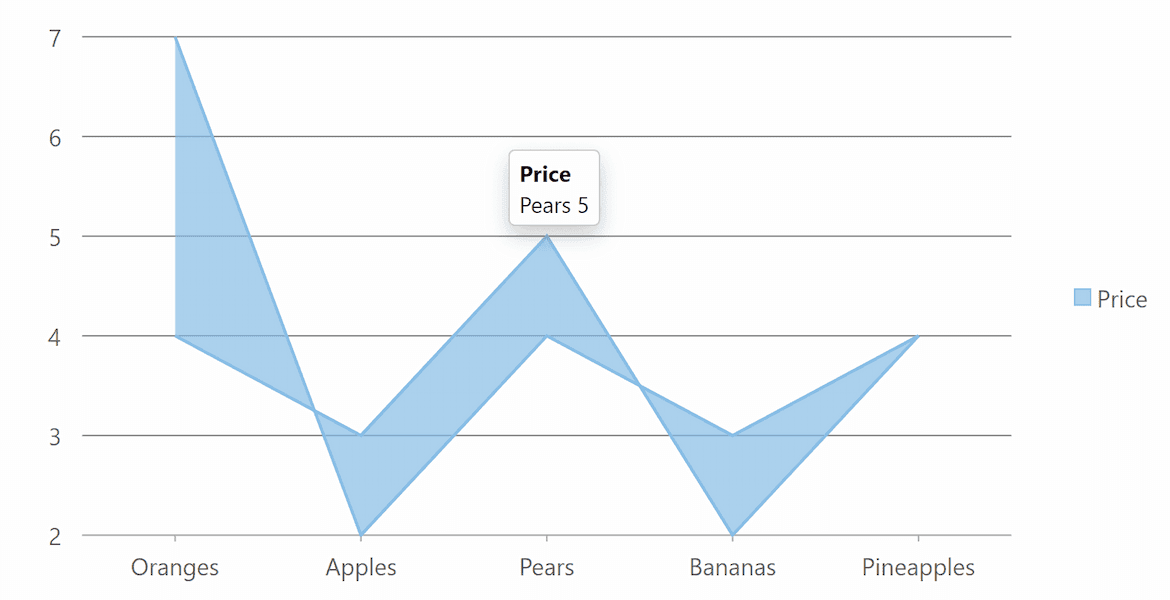
Data Labels & Tooltips
Display precise chart values in labels attached to each data point. FlexChart can automatically display the formatted value or percentage within labels and tooltips. Prevent data labels from overlapping so all data is visible.
-
Annotations
Annotations improve clarity of the chart using arbitrary text, images and shapes that can be attached to data points or plot coordinates. You can even allow end-users to edit annotations in FlexChart.
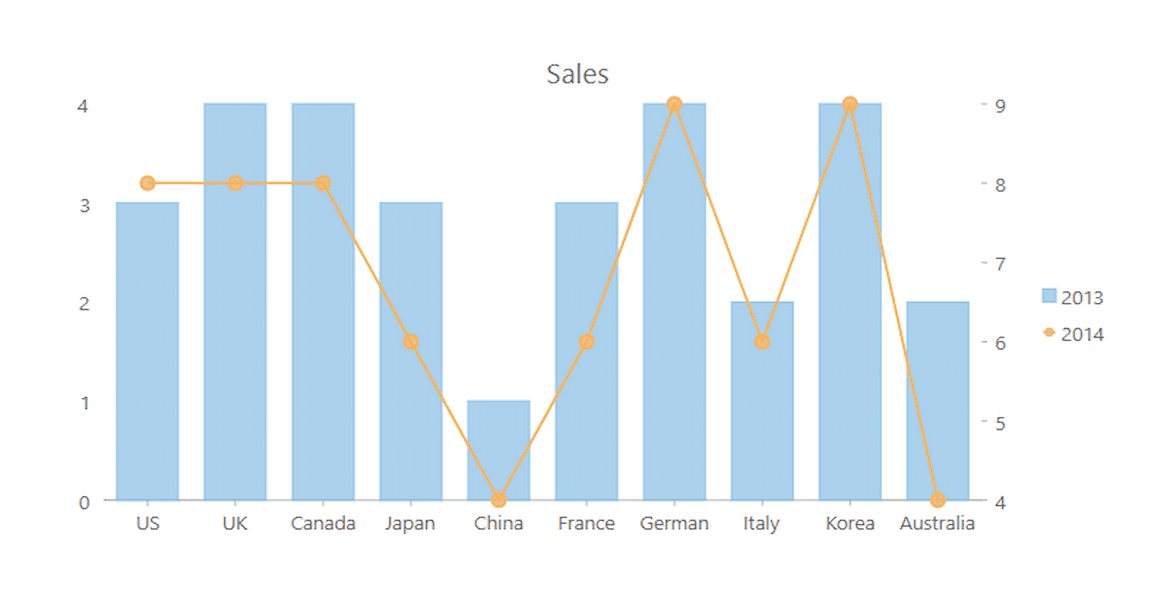
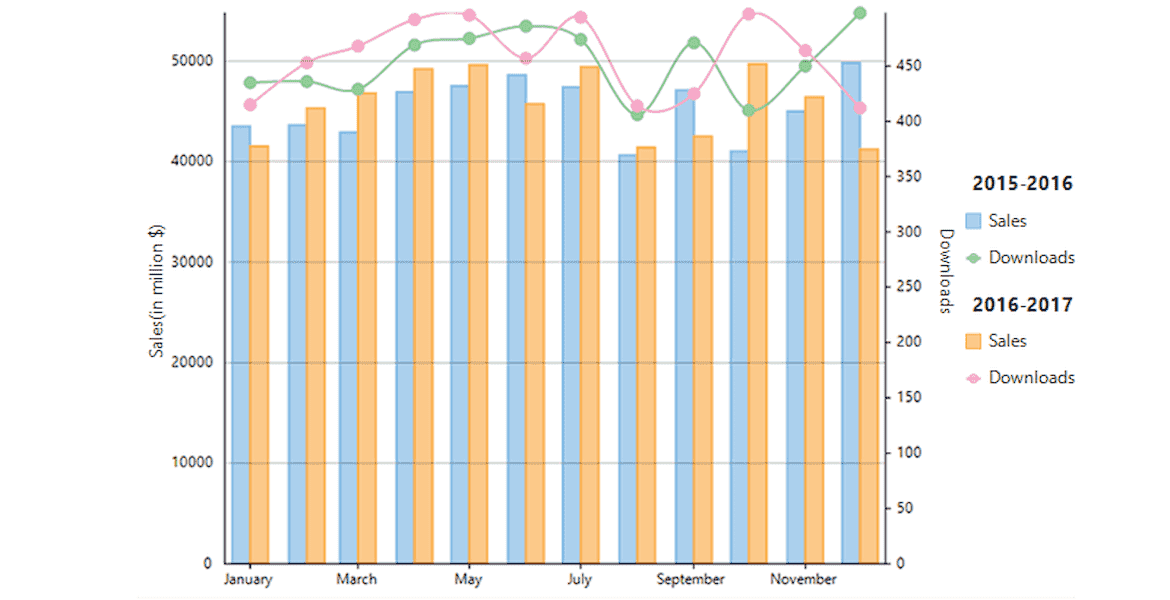
Combination Charts
Easily combine any Cartesian chart types into a single plot using FlexChart's flexible model. Each series can be set to a different chart type, allowing endless composite chart combinations.
WinForms| WPF| UWP| ASP.NET MVC| Blazor
-
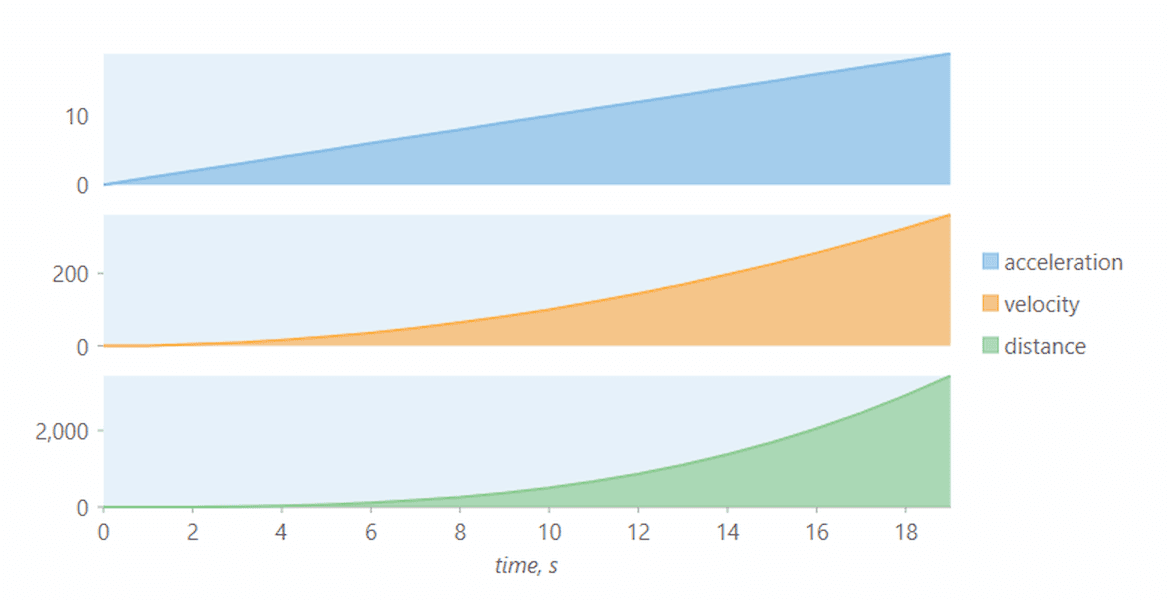
Multiple Plot Areas
Define multiple plot areas to display plots stacked horizontally and vertically. Stacking plot areas helps visualize multiple series in a single chart.
WinForms| WPF| UWP| ASP.NET MVC| Blazor
-
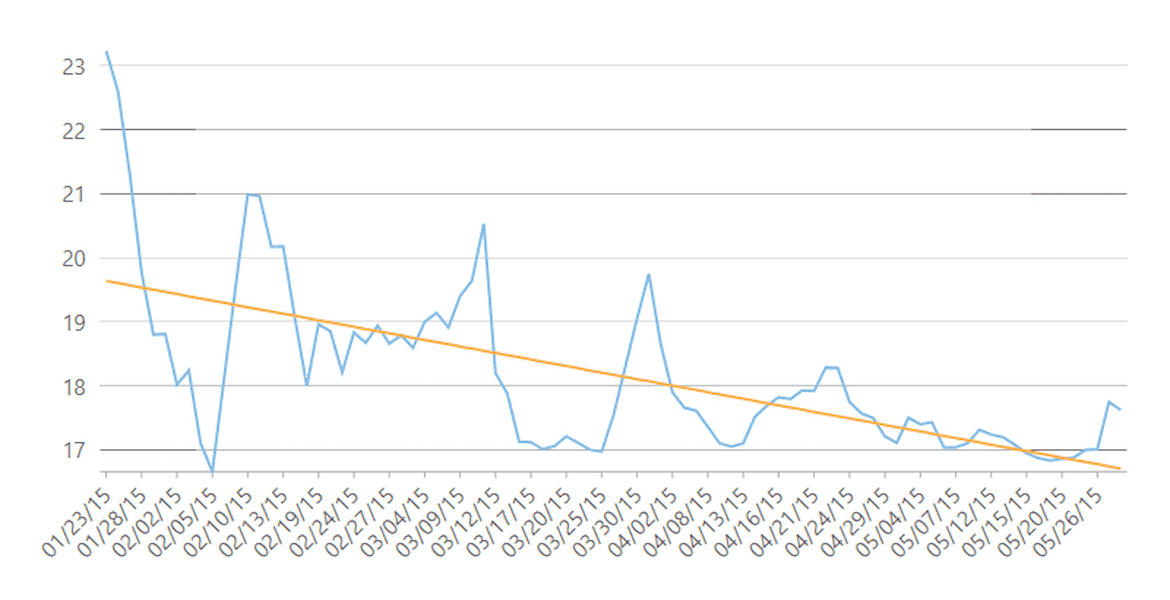
Trendlines
Add trend lines to show trends in data and make predictions. FlexChart supports several built-in regression and non-regression trendlines such as linear, average and polynomial.
WinForms| WPF| UWP| ASP.NET MVC| Blazor
-
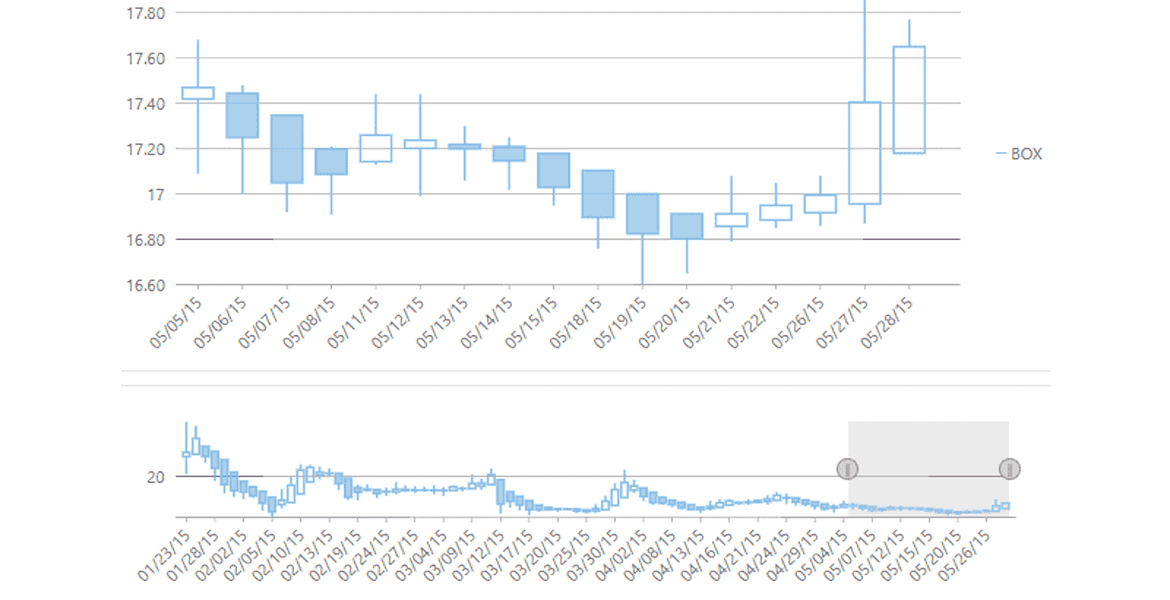
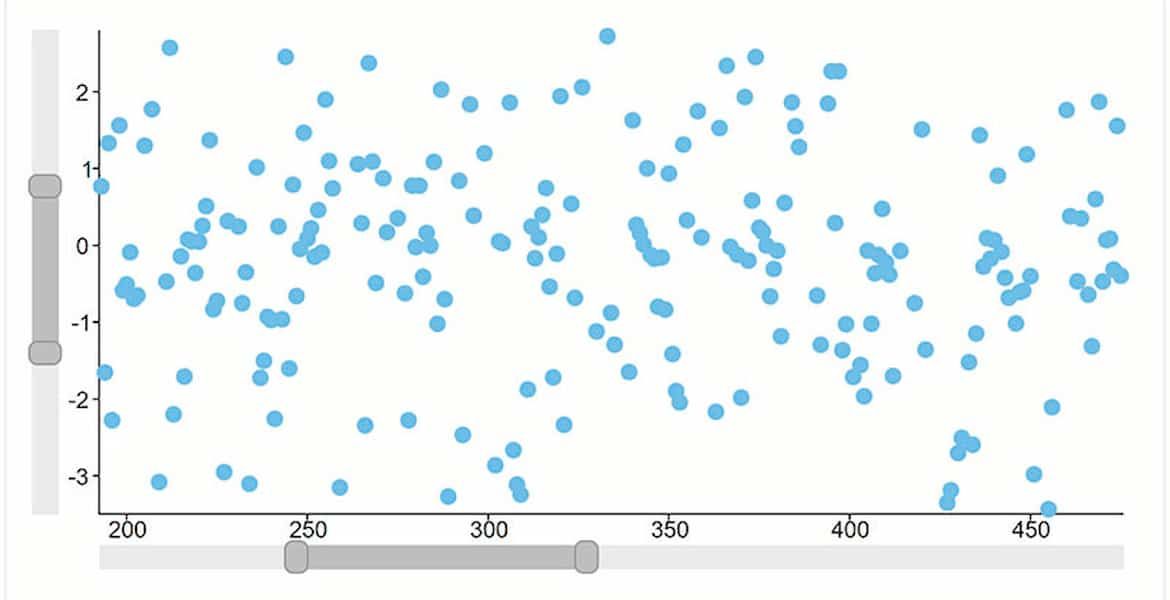
Range Selector
With the range selector, you can enable scrolling between two charts where one is a preview of all data and one is filtered (or zoomed) to the selected range for closer analysis.
WinForms| WPF| UWP| ASP.NET MVC| Blazor
.NET Chart Demo
-
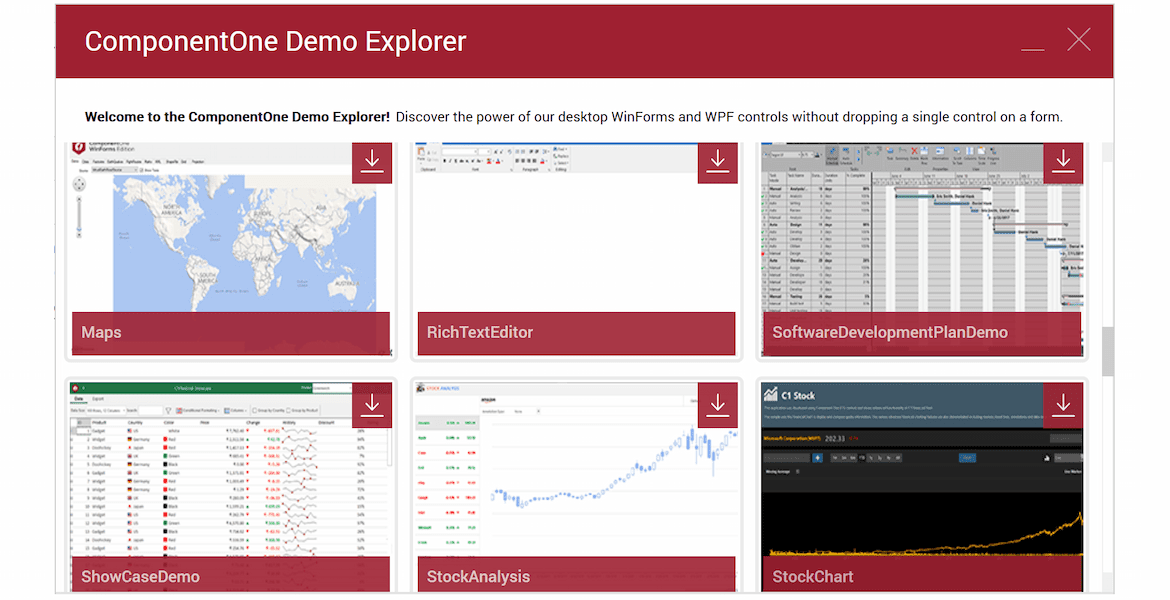
Desktop Demo Explorer
All WinForms and WPF demos are included in the downloadable desktop explorer. Check out all the features and showcase demos of FlexChart.
Download Demo Explorer -
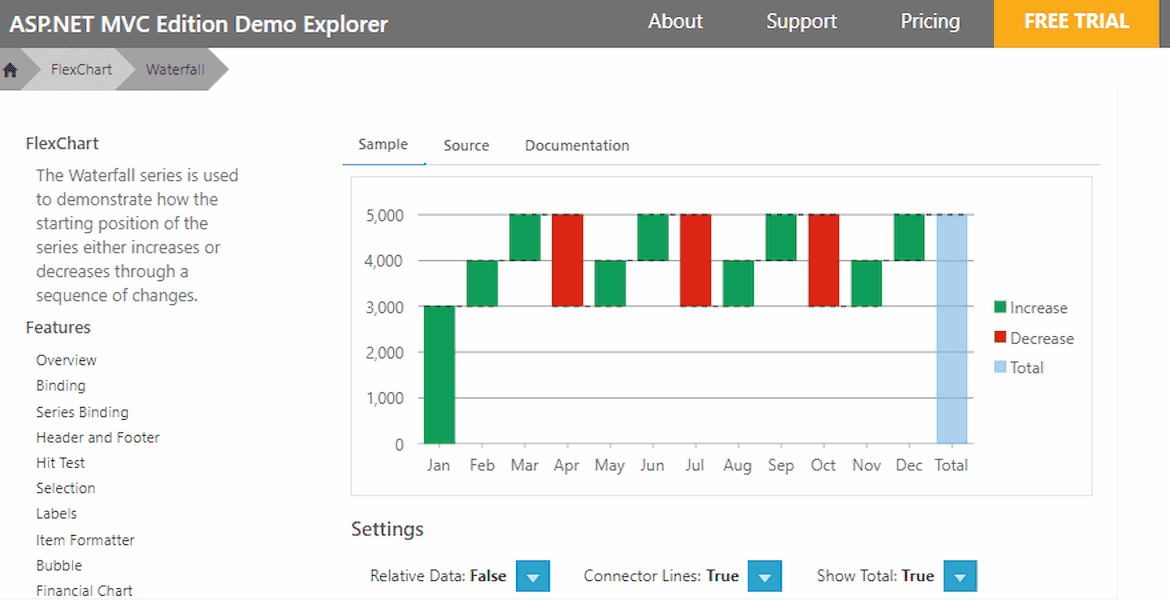
ASP.NET MVC Chart Demo
We'll show you a demo right in your browser. You can configure key properties and see what .NET charts can do for your ASP.NET MVC application.
Run Demo -
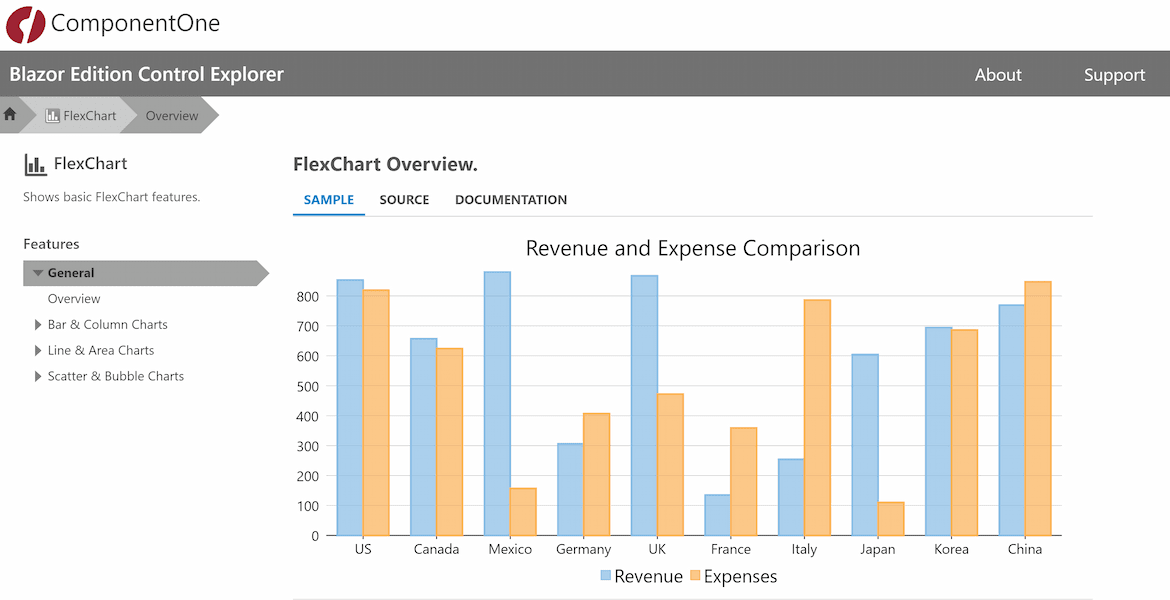
Blazor Explorer
Explore all the key features of FlexChart for Blazor, including data binding, annotations, animations, and more. A WebAssembly demo is also available.
Run Demo
ComponentOne Enterprise Free Trial
ComponentOne Enterprise
Expand your development reach across all .NET platforms with ComponentOne Enterprise.