

Why You Should Choose SpreadJS ReportSheet
Excel-Based Web Report Automation
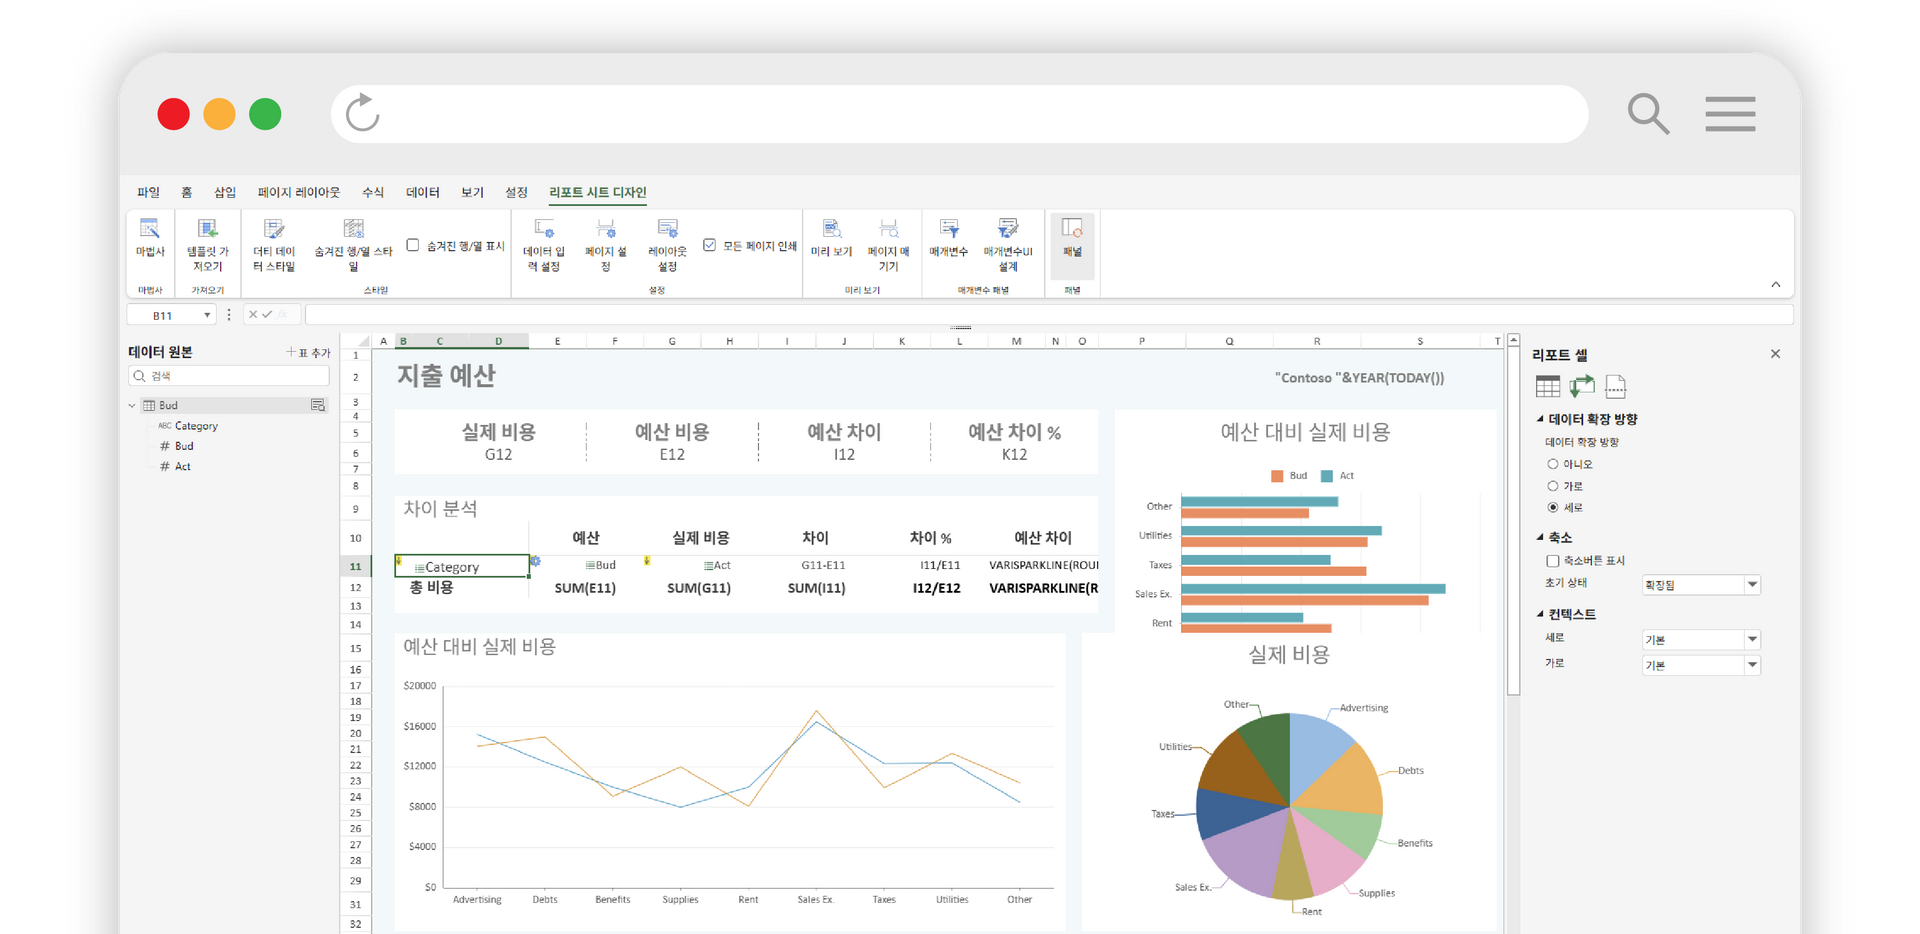
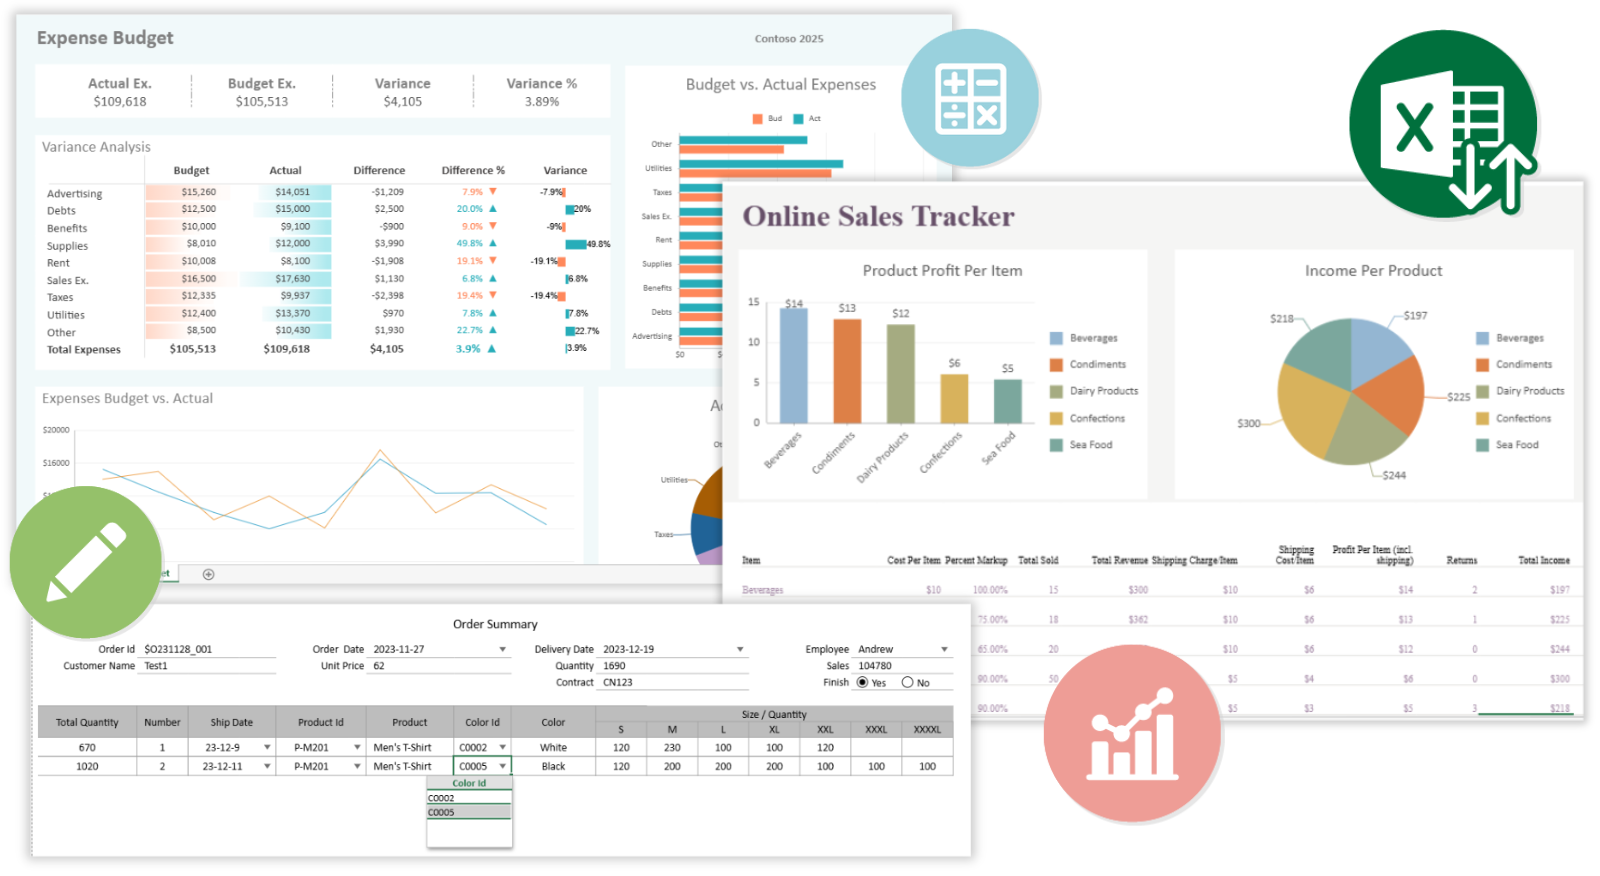
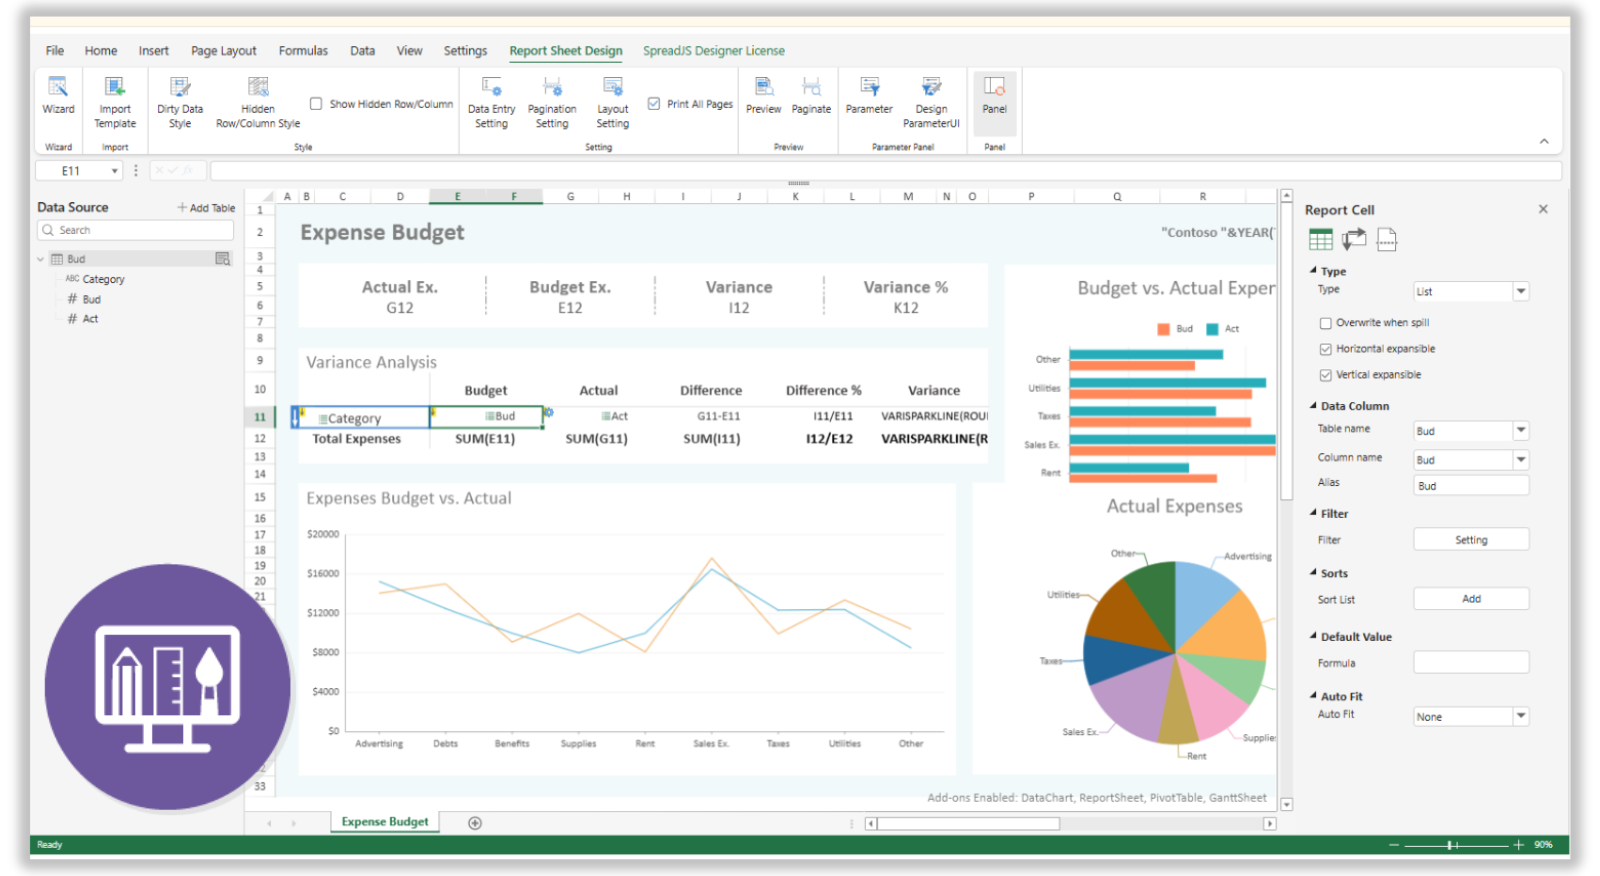
Create powerful JavaScript web reports with a familiar Excel spreadsheet experience.
Supports worksheets, tables, charts, and formulas, and integrates seamlessly with existing workflows through XLSX import/export.
Experience the SpreadJS ReportSheet Right Now.
Try out the Excel UI-based report automation features firsthand with a free trial and see everything it has to offer.




SpreadJS ReportSheet Key Features
Implement Excel-Based Reporting with ReportSheet
Complete reporting features from data entry to verification

Data Entry
Converts spreadsheet templates into interactive forms with full CRUD support. Users can add, update, and delete records directly in the report.

Formula Functions
Use formulas dynamically based on cell context, with support for context-aware calculations, hierarchical indexes, page number formulas, and more.

Parameters
Build dynamic and interactive reports by filtering data based on runtime values. Set values such as date ranges or customer IDs dynamically.

Data Sorting
Control the sort order of report data using columns, cells, formulas, or custom lists. Define multi-level sorting rules directly in the template.

Data Filter
Precisely control the data displayed in the final output by defining flexible filtering conditions within report templates. Supports static conditions, dynamic formulas, and join logic.

Data Validation
Define validation rules in the TemplateSheet to enforce robust data integrity throughout the report generation process. Apply numeric ranges, restrict dropdown selections, and more.

Template Cell Type
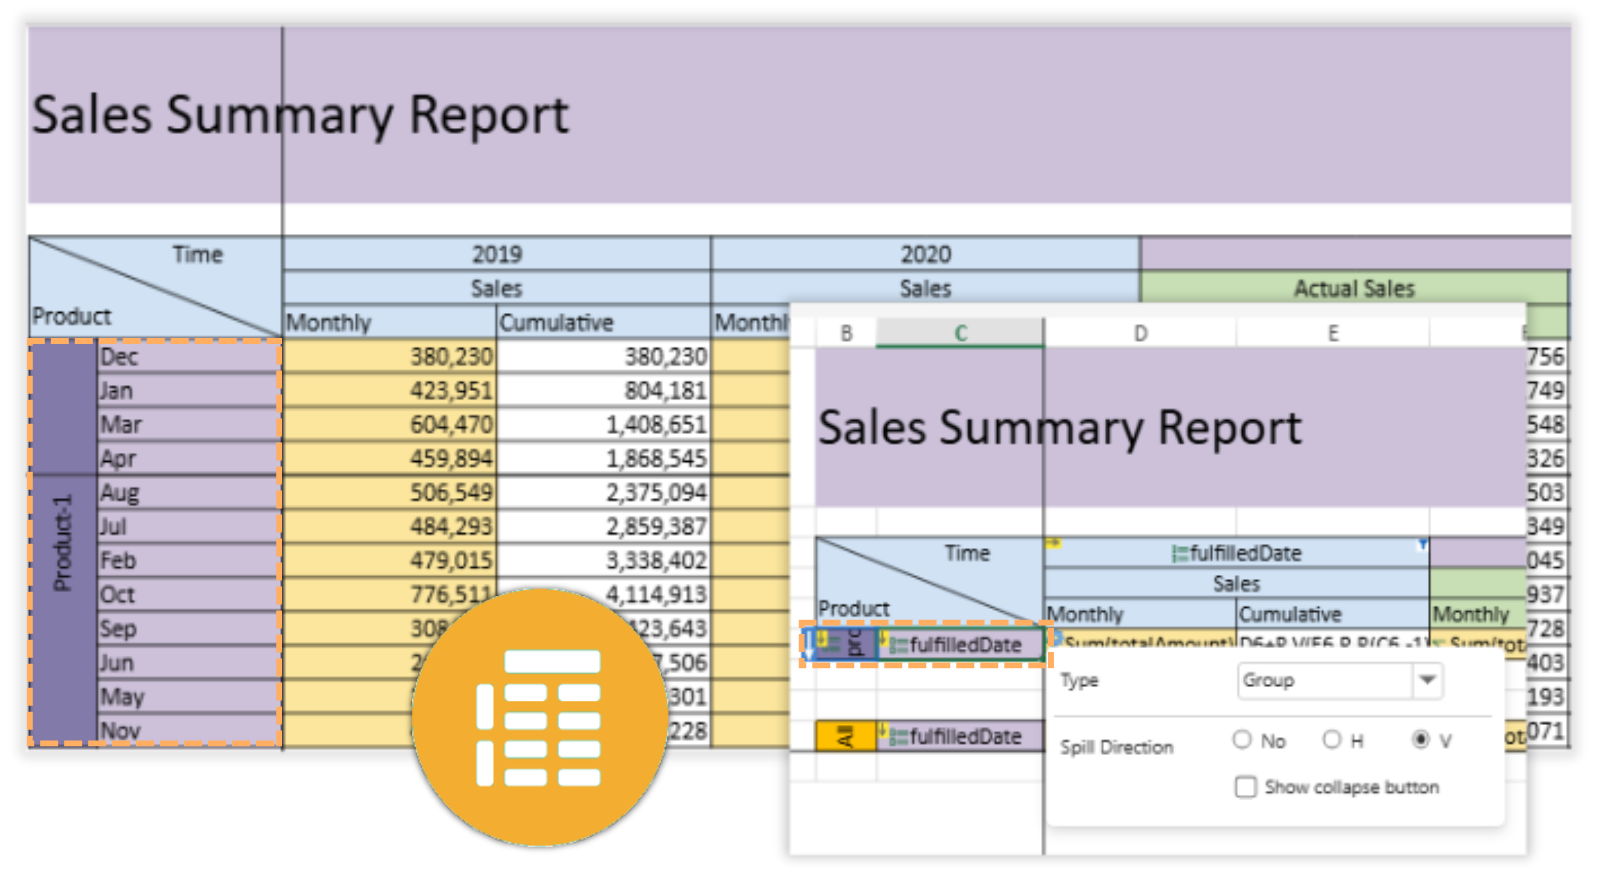
Powerfully control layout and data behavior using special template cell types such as Group, List, Summary, and Static. Easily defined in code or the Designer.

Spill Mode
Fine-tune how repeating data is rendered in the spreadsheet report layout. Choose between Insert or Overwrite modes.

Row & Column Layout
Use Row Layout and Column Layout modes to fully control how repeating data is arranged in page output. Useful for optimizing screen or print space.

Pinning
Fix static cells to prevent layout shifting caused by spilled report data. Ideal for anchoring titles, labels, or headers to dynamic templates.

Conditional Formatting
Dynamically apply styles to cells based on data values or logical conditions, such as highlighting below-target sales or overdue dates.

Image Support
Add static images such as logos, charts, icons, or visual indicators directly to the TemplateSheet. Create reports that are both informative and visually engaging.

Row Paging
Fully control the number of data rows rendered per page in a paginated ReportSheet. Ideal for printable reports or long data sets.

Paper Size-Based Paging
Adjust page-splitting behavior to fit standard paper sizes such as A4, Letter, or Legal. Perfect for print-friendly output.

Chart Support
Create dynamic, data-driven visualizations by adding data charts directly to the ReportSheet. Bind charts to table data to reflect real-time changes.

Show/Collapse Button
Add interactive show/collapse buttons to the ReportSheet template, allowing users to expand or hide grouped data sections at runtime.

Import & Export
Seamlessly import and export ReportSheet templates and generated reports in XLSX format. Ensures smooth integration with existing workflows.

Print Report
Print report spreadsheets directly from your JavaScript application to generate professional, print-ready output.
SpreadJS Excel ReportSheet Quick Start Guide
Excel-Based Report Engine, ReportSheet Quick Start Guide
From template design to data integration and web deployment, follow these 5 steps to automate complex business reports in the most familiar and efficient way.

Run Template Designer
Launch the dedicated template designer to prepare your visual editing environment.

Excel Report Template
Load an existing Excel report and retain the original form structure.

JSON Data Binding
Connect your API and drag data fields into the required cells to bind them.

Export Report
Export the completed configuration as a JSON file, ready to apply to your project.
템플릿 디자이너 실행 및 시트 설정
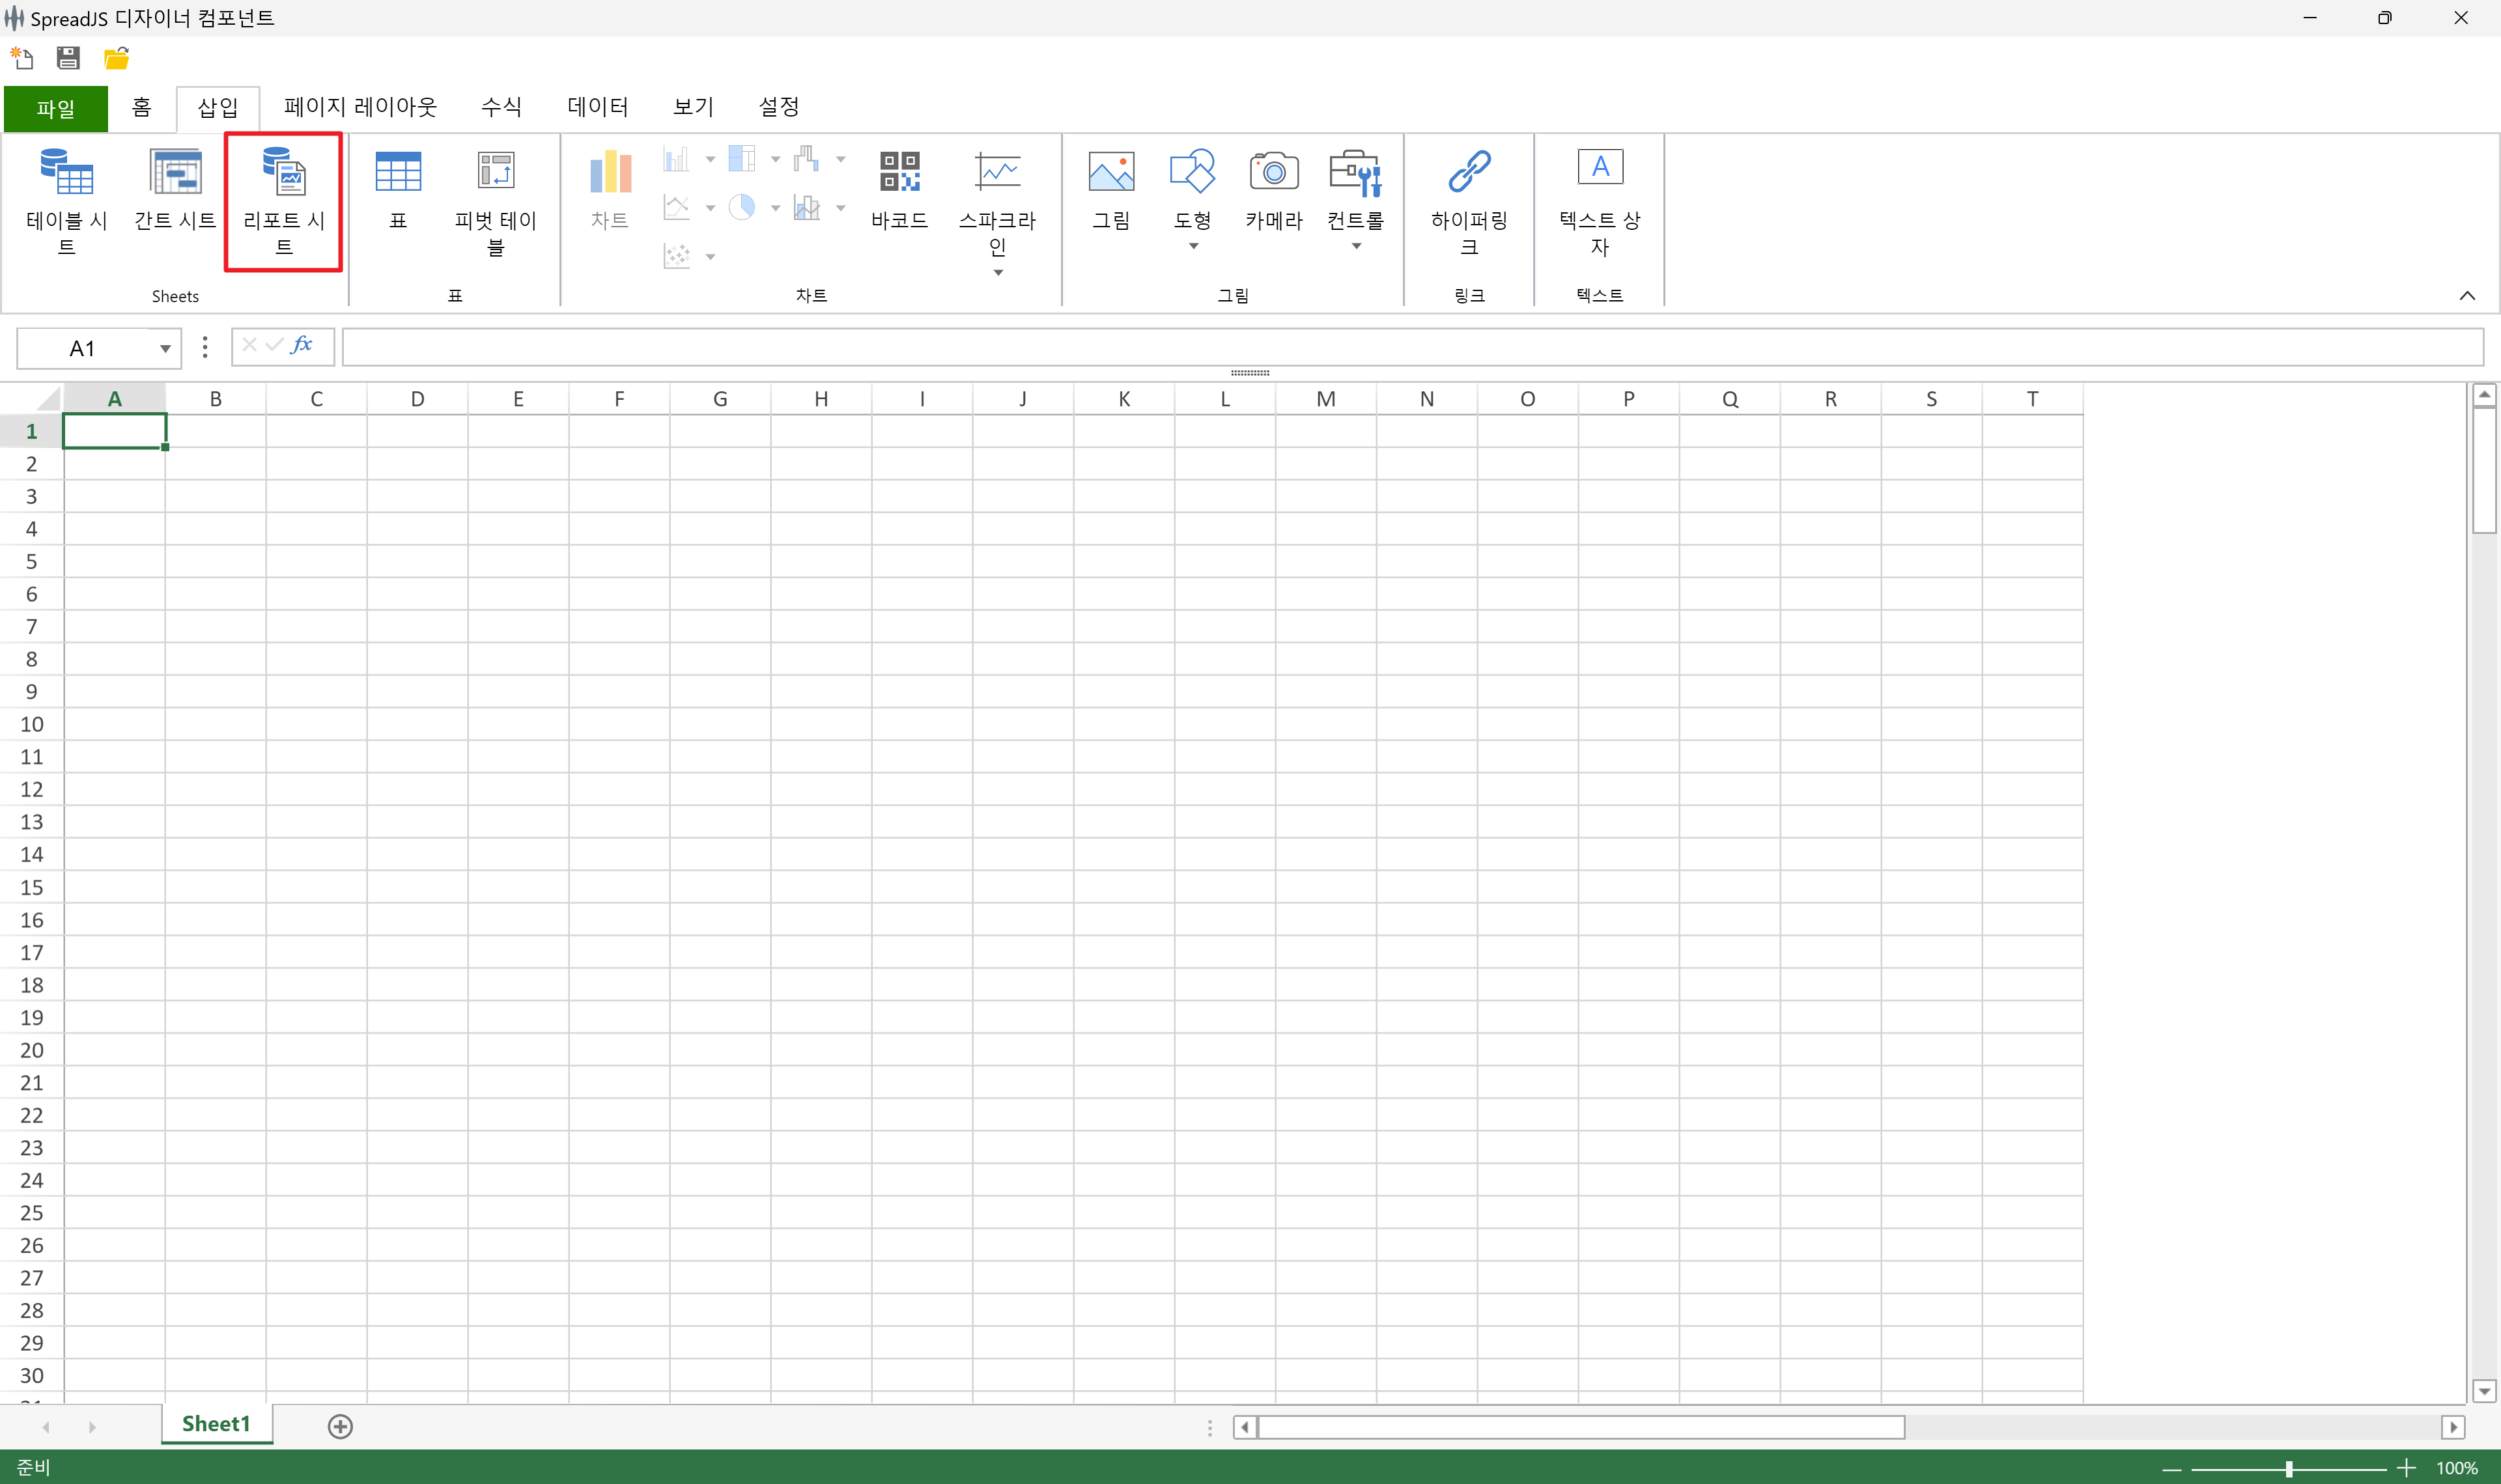
먼저 SpreadJS 템플릿 디자이너를 실행합니다. 상단 메뉴의 [삽입] 탭에서 [리포트 시트] 버튼을 클릭하여 보고서 개발 환경을 활성화합니다. (*SpreadJS v17 이상)
엑셀 리포트 템플릿 로드 및 디자인
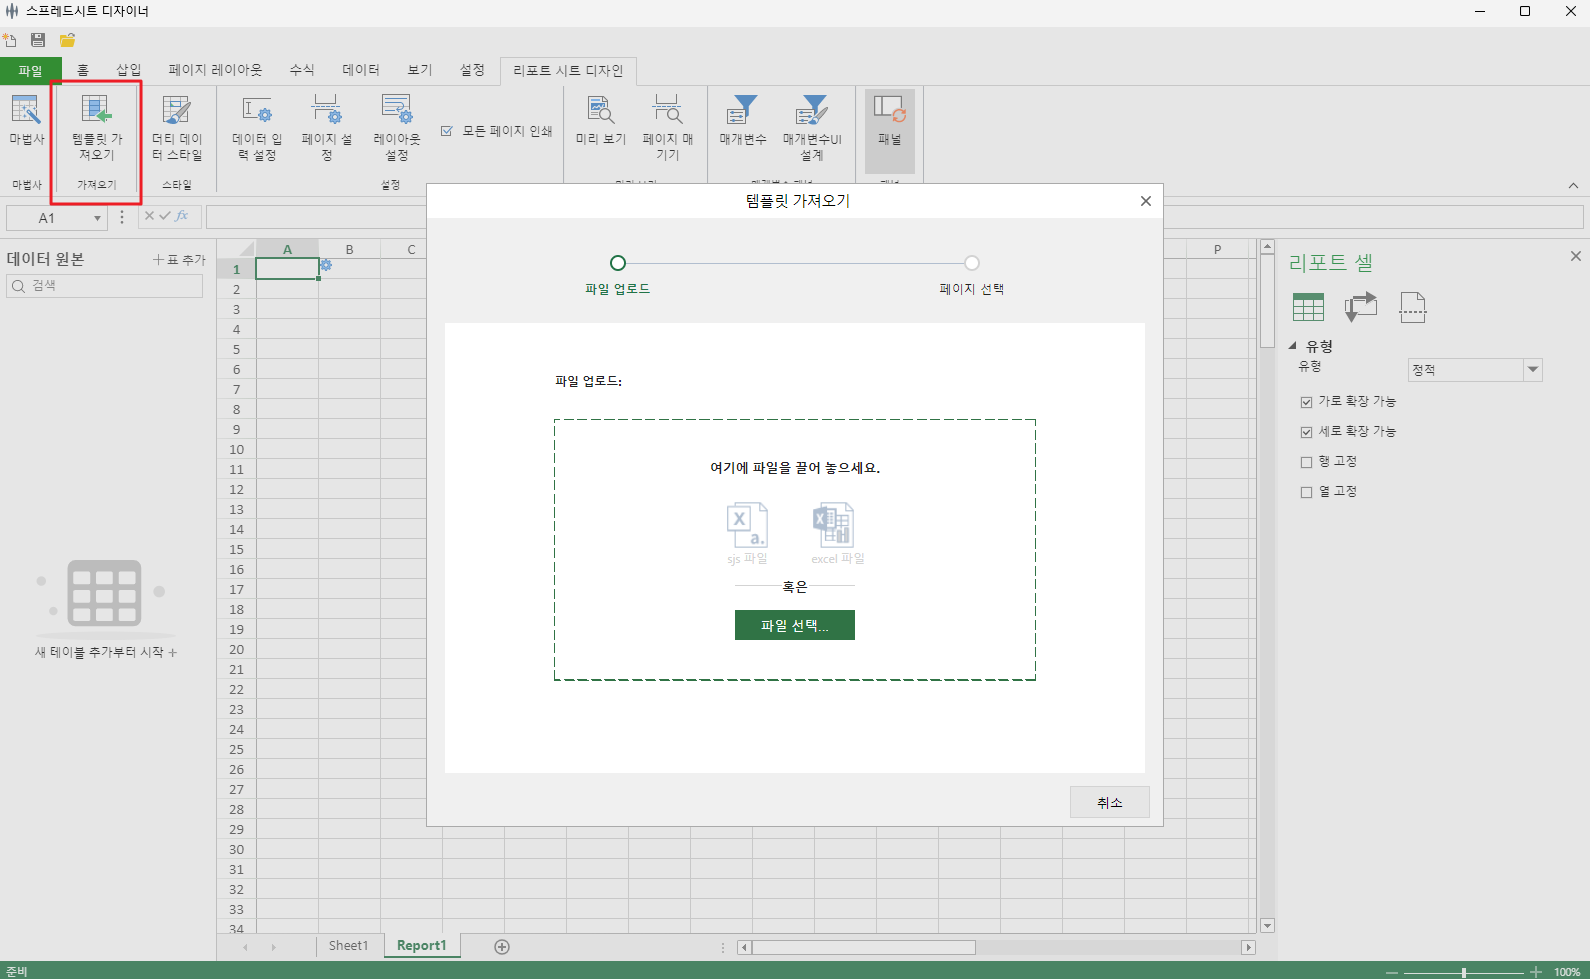
기업에서 사용 중인 엑셀 양식(.xlsx)을 그대로 불러와 리포트의 기반으로 활용합니다.
디자이너 상단의 [리포트 시트 디자인]
탭을 선택하고, 가장 좌측의 [템플릿 가져오기]
를 클릭하여 기존 양식을 로드하세요.
STEP 1 : 메뉴에서 파일 선택 (기존 양식 불러오기)
* 샘플 Excel 파일이 필요한 경우 아래 링크를 참고해 주세요.
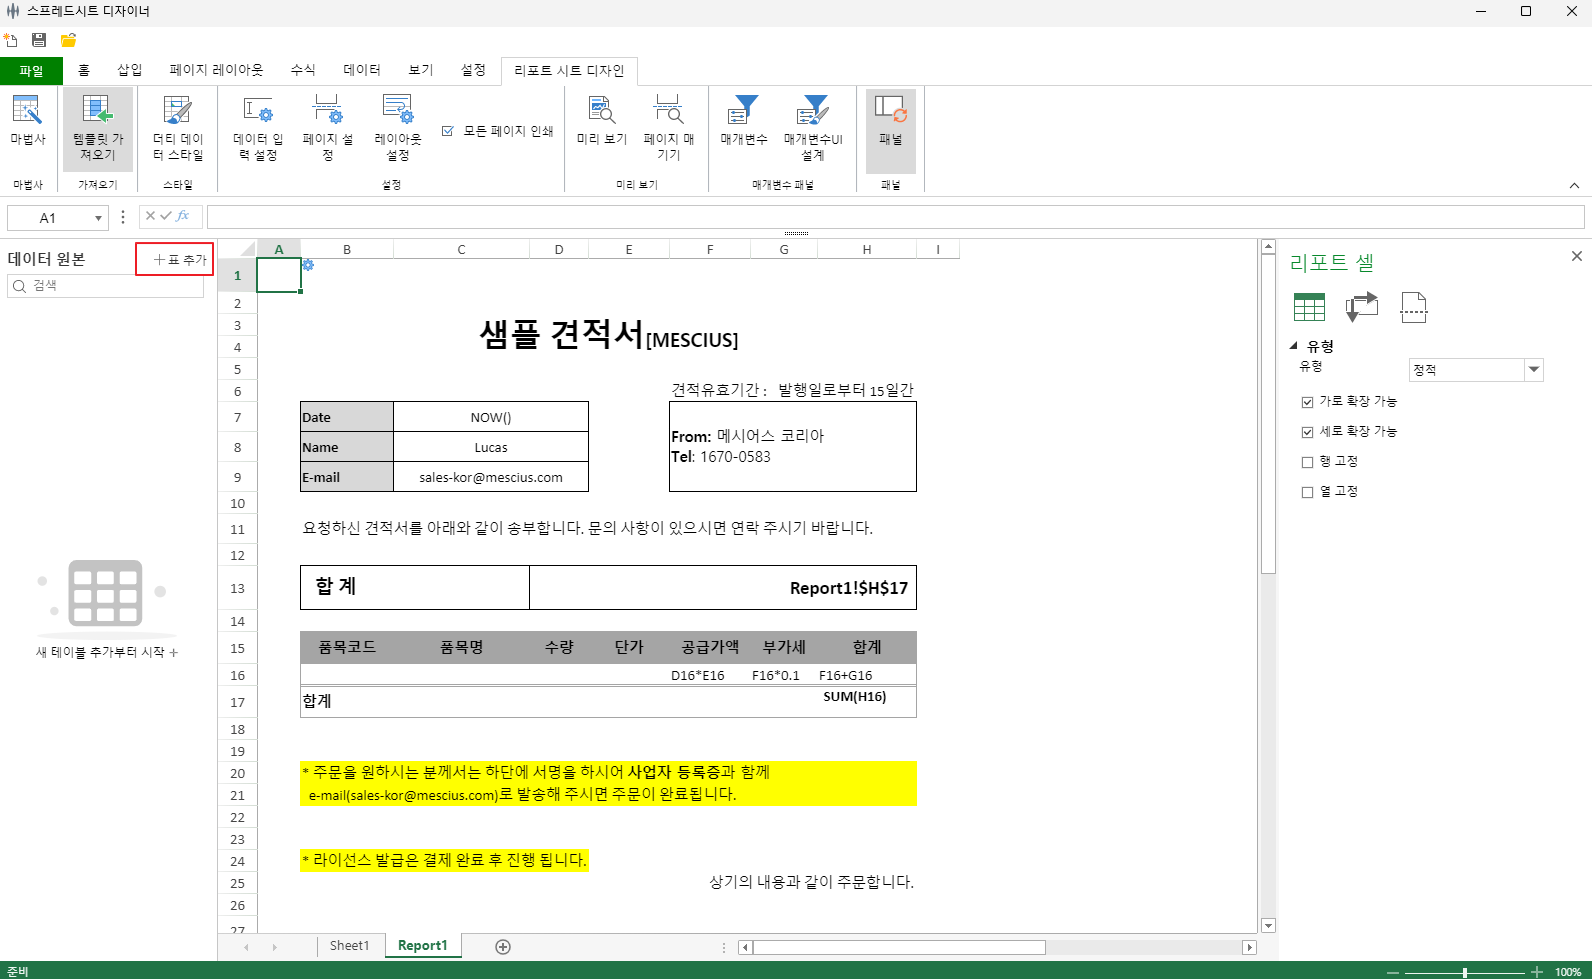
STEP 2 : 템플릿 로드 완료 (엑셀 서식 유지)
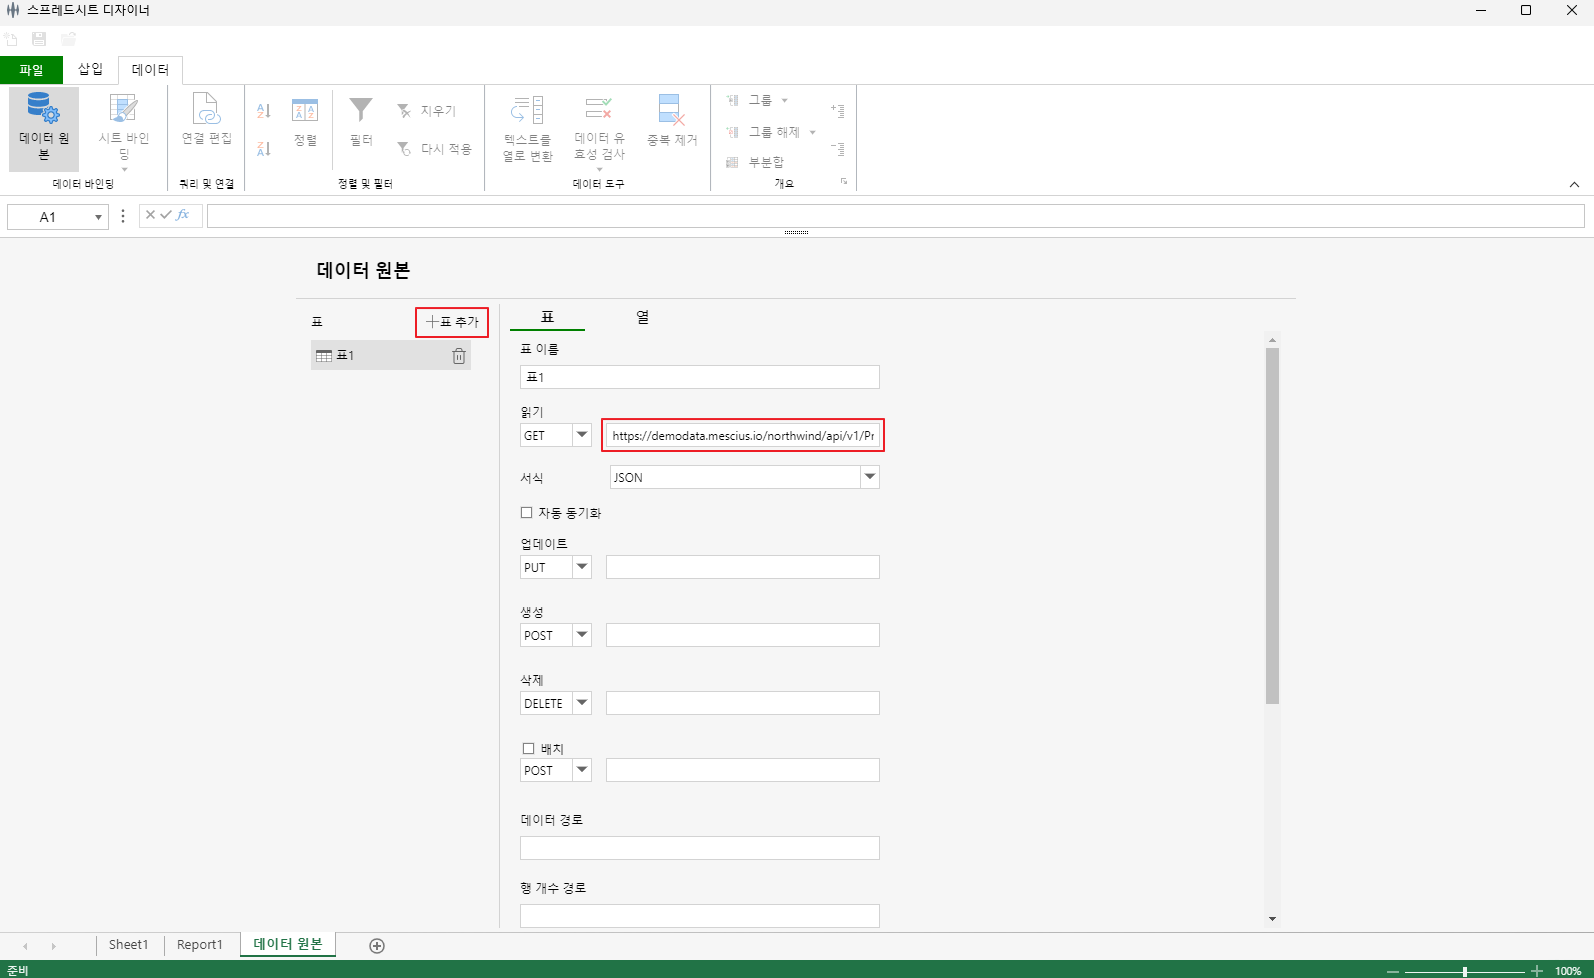
JSON 데이터 연동 및 바인딩
Rest API URL을 입력하면 DataManager가 데이터 스키마를 자동으로 분석하여 시각화된 필드 리스트를 제공합니다.
* 아래 REST API URL을 클릭하면 해당 페이지로 이동합니다.
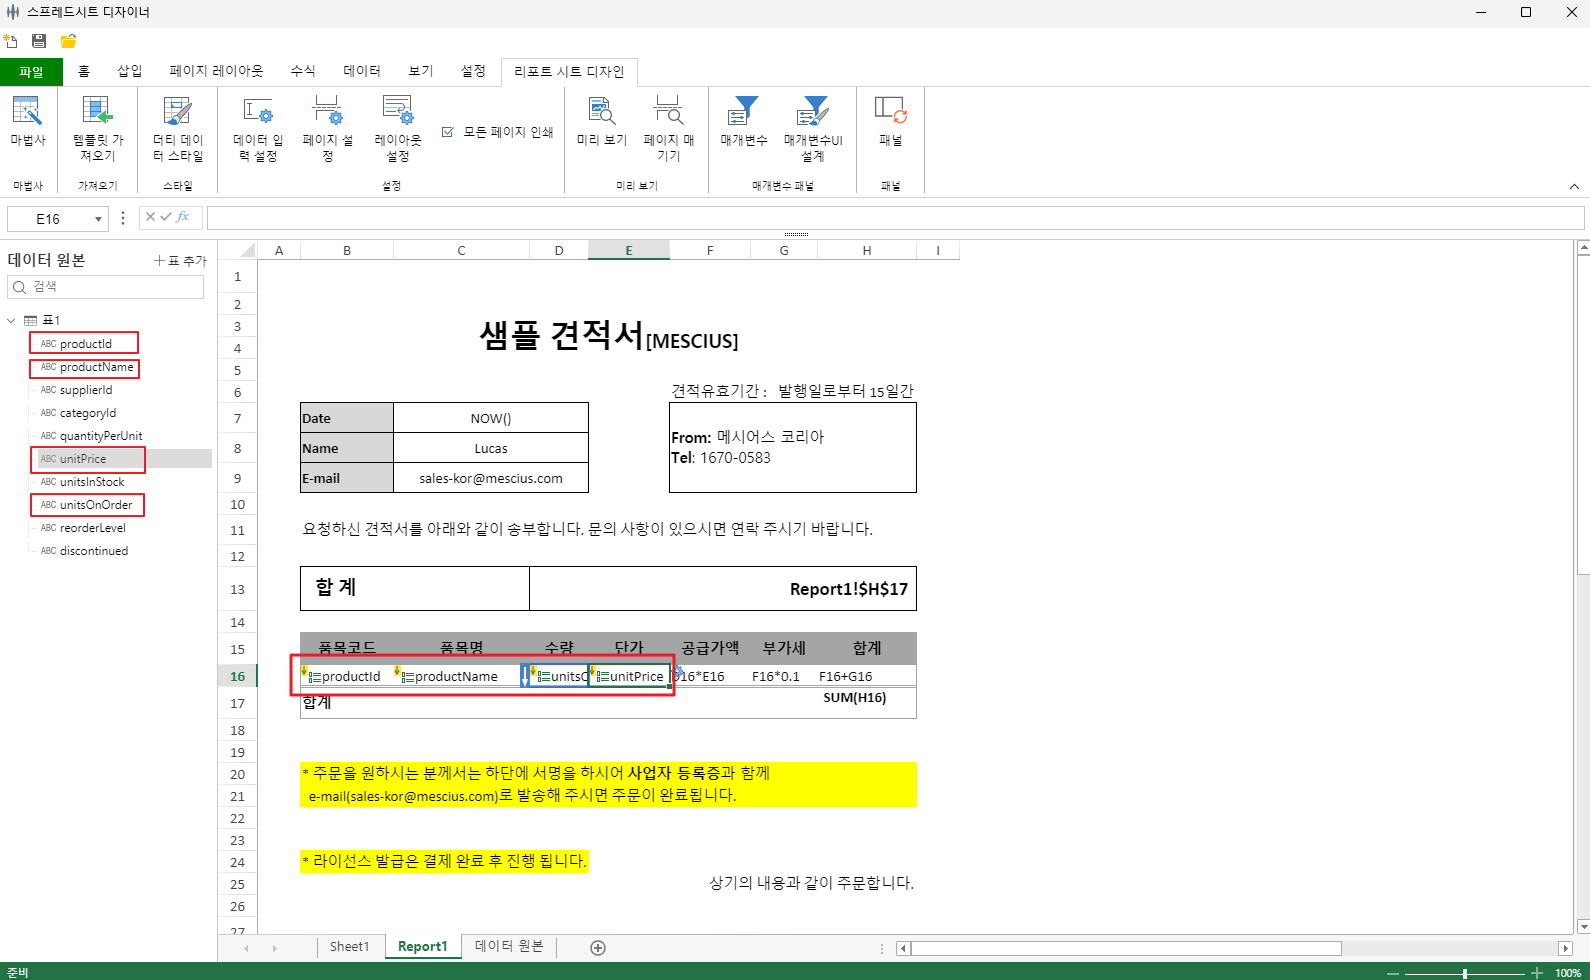
분석된 데이터셋의 필드 항목을 엑셀 템플릿의 셀 위로 드래그 앤 드롭 하세요. 해당 셀을 기점으로 데이터가 설정된 방향으로 자동 확장됩니다.
리포트 데이터 검증 및 내보내기
Validation : 실시간 데이터 미리보기
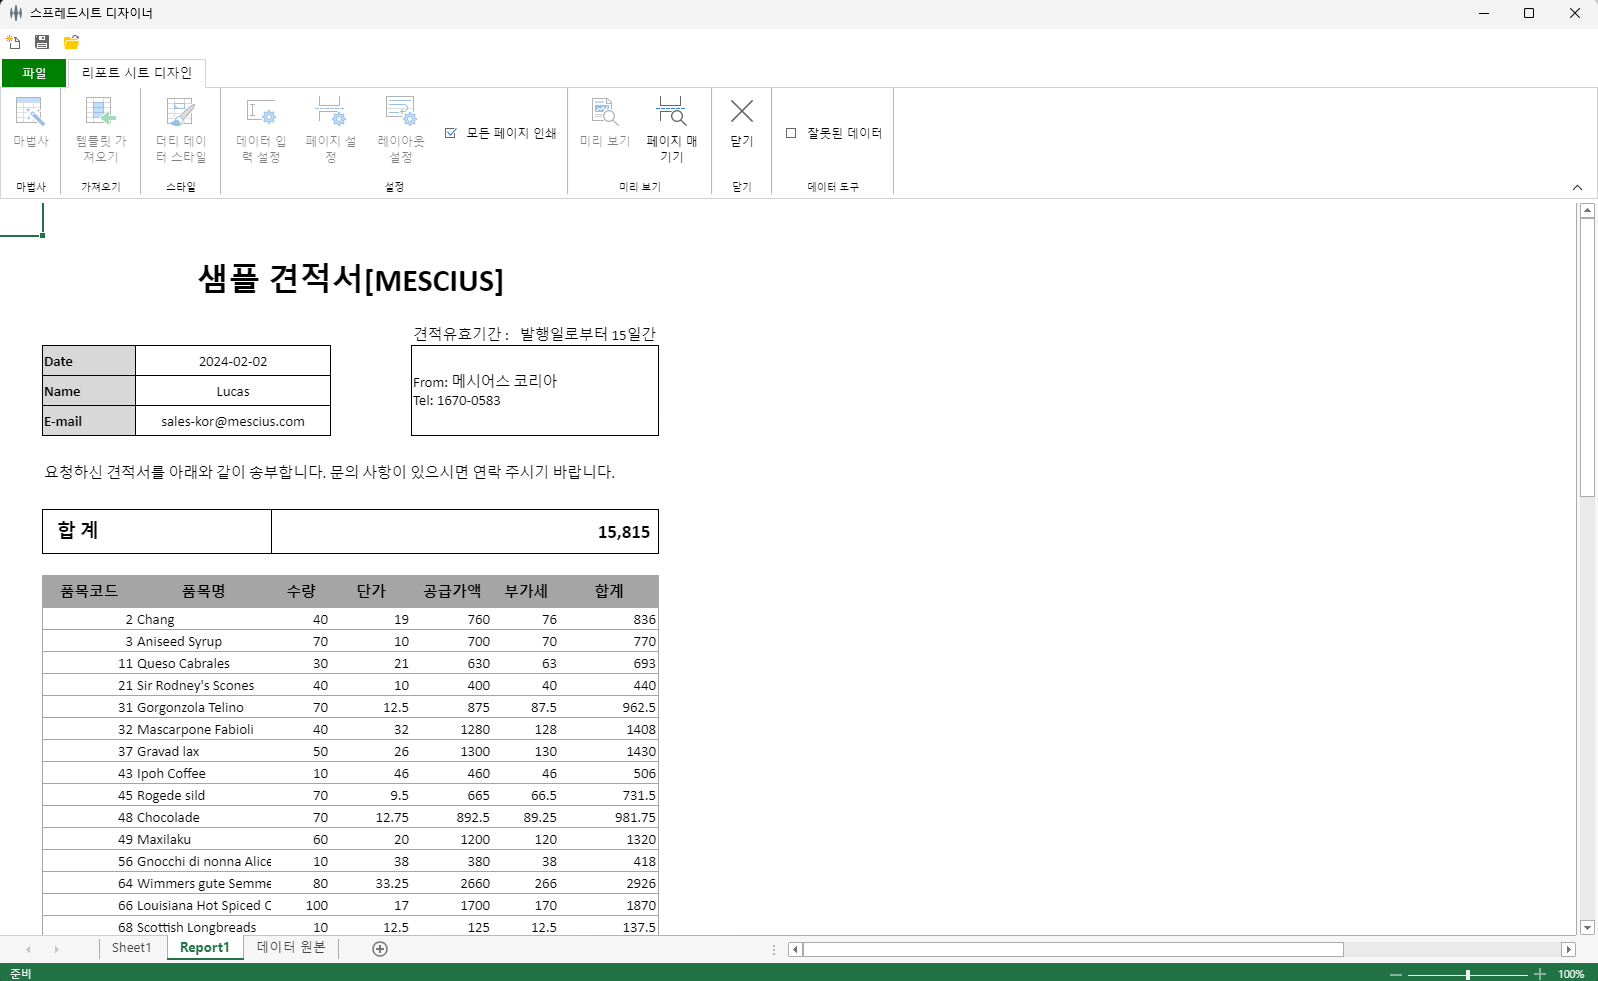
디자인이 완료되면 상단 리본 메뉴의 [미리 보기] 를 클릭합니다. 실제 API 데이터가 템플릿 서식에 맞춰 바인딩된 최종 결과물을 즉시 확인할 수 있습니다.
Export : SpreadJS JSON으로 내보내기
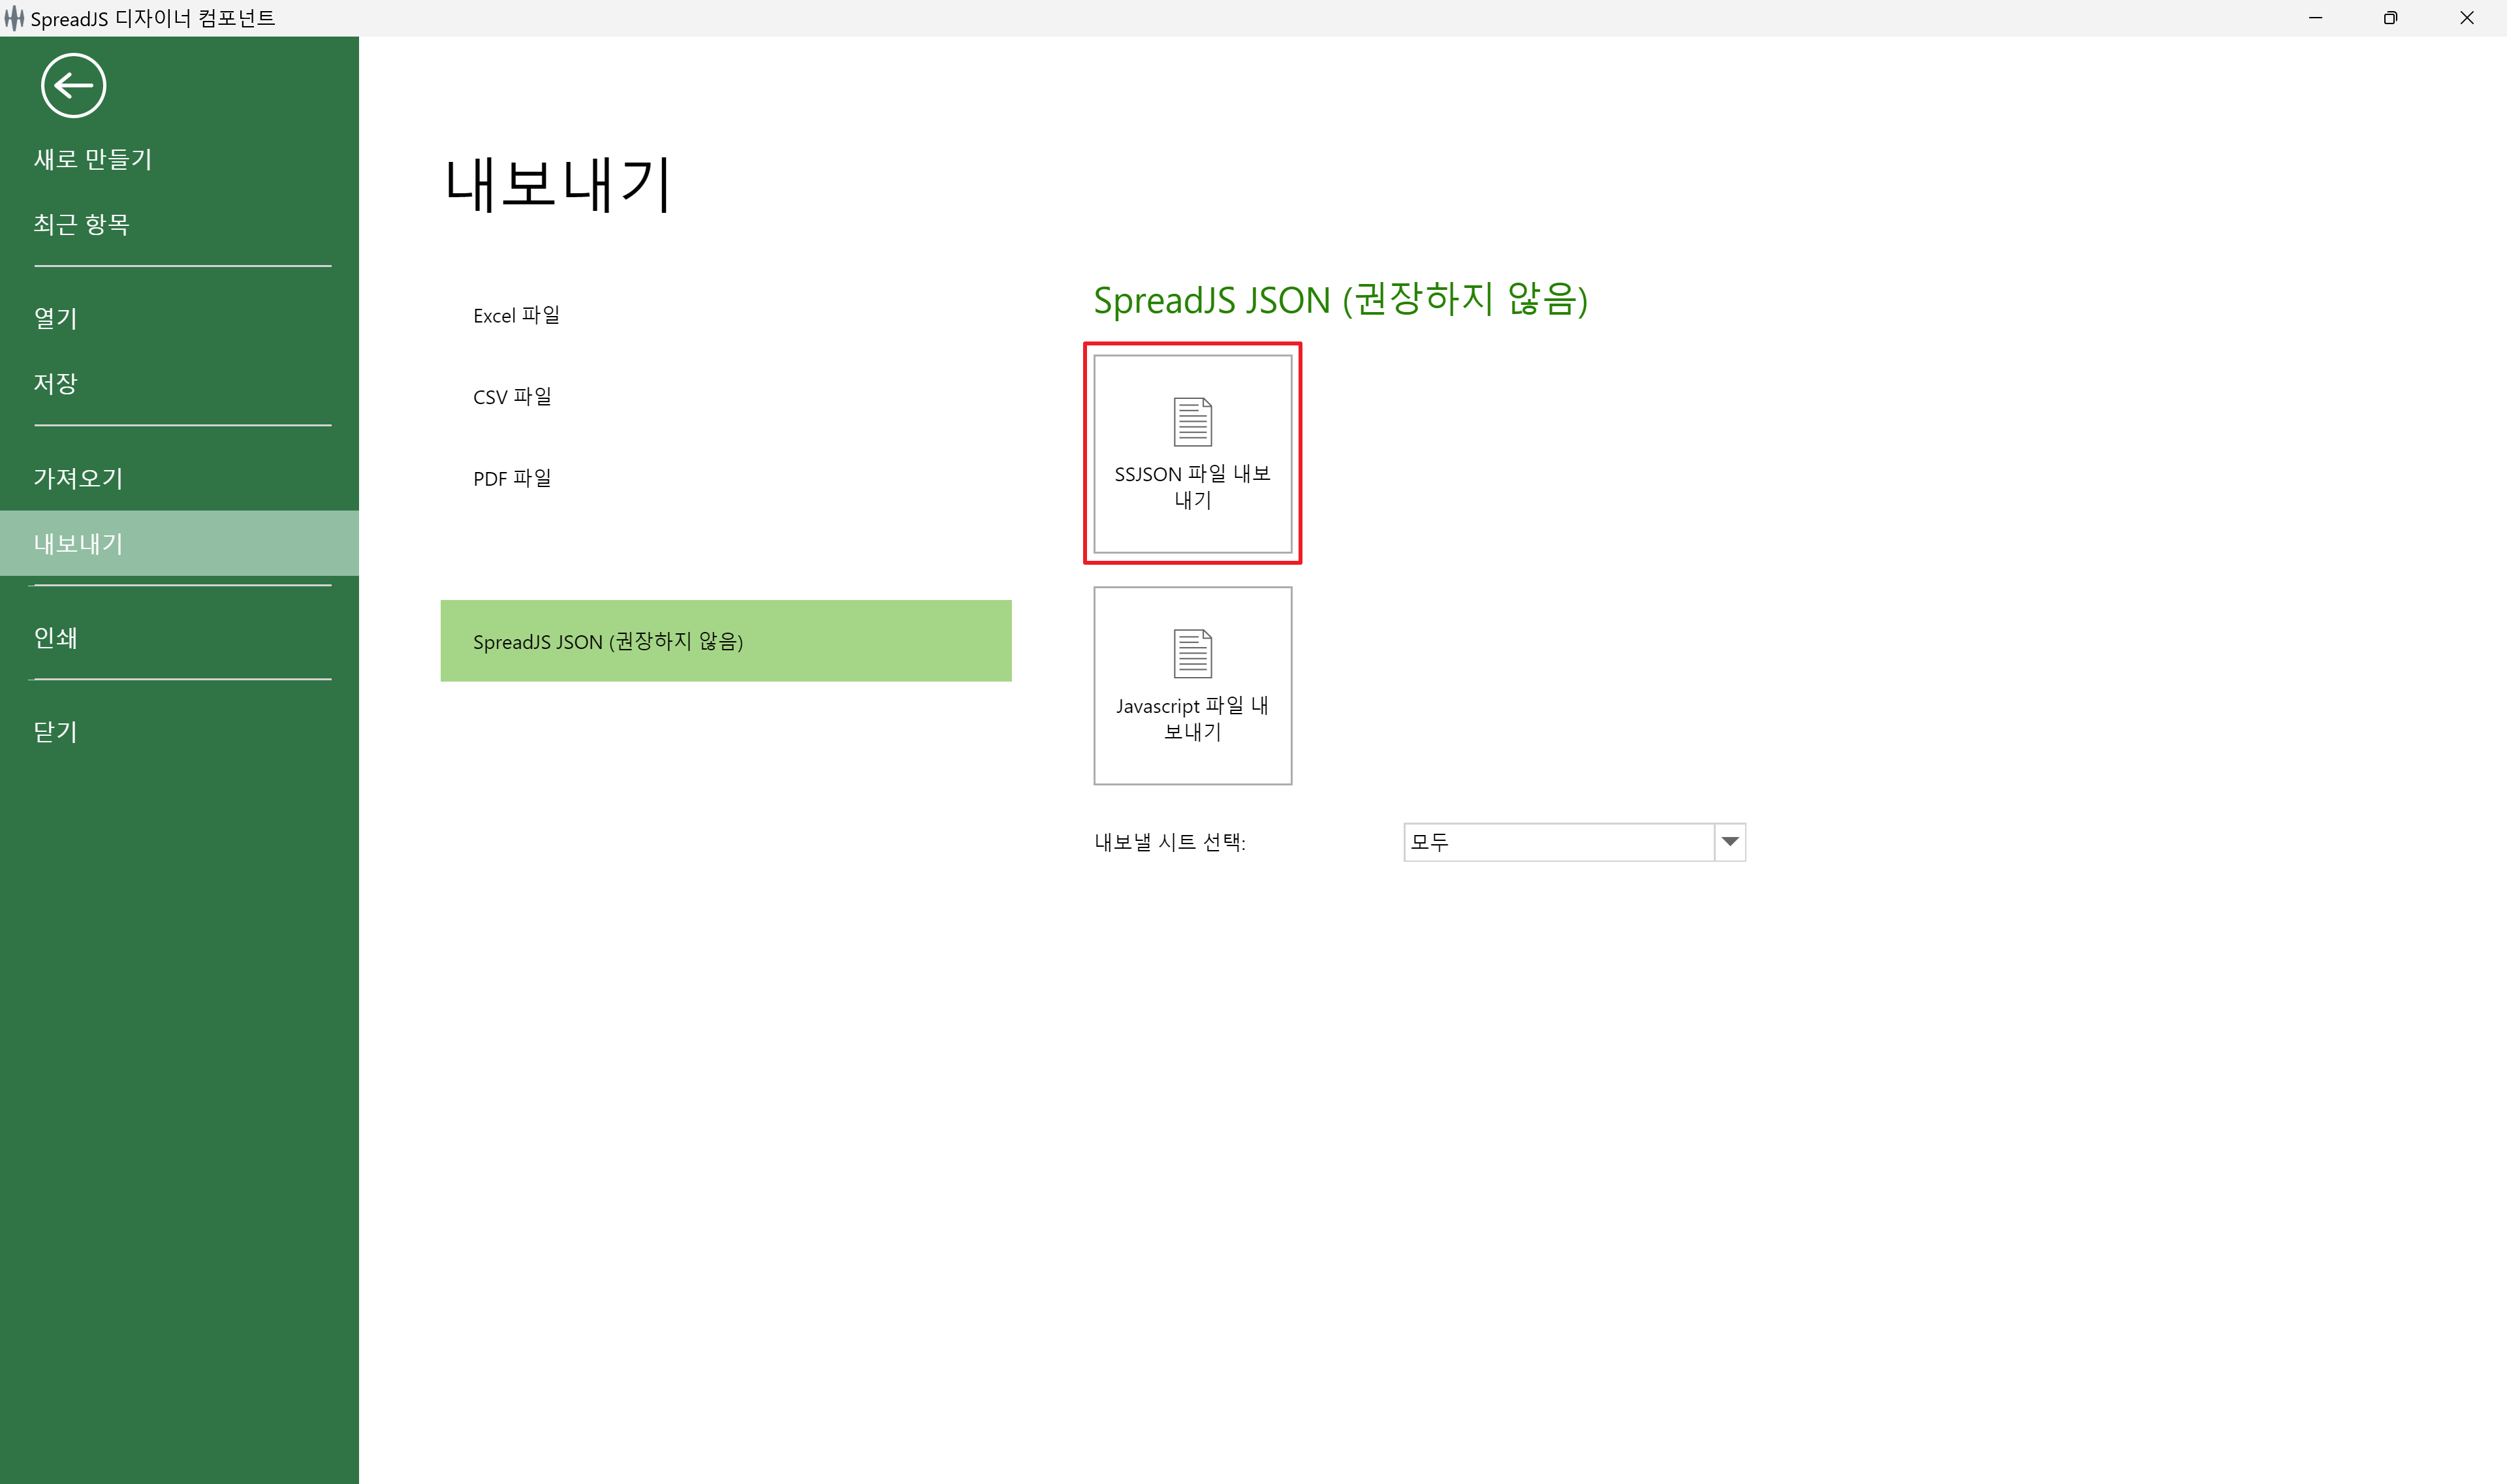
데이터 검증이 완료되면 웹 프로젝트에서 사용할 템플릿 파일을 생성합니다. [파일] > [내보내기] > [SpreadJS JSON] 을 선택하여 저장하세요. 이때 파일명은 기본적으로 report_template.ssjson을 권장하나, 사용자의 편의에 맞춰 리포트 파일명 으로 지정하여 내보낼 수 있습니다.
웹 리포트 렌더링 및 배포
저장된 JSON 파일을 fromJSON API를 사용하여 웹 프로젝트에 로드합니다. 이때 ReportSheet 전용 플러그인 을 반드시 포함해야 합니다.
  <script
 src
= ".../gc.spread.sheets.all.min.js"
 ></script>

 <!-- 리포트시트 플러그인 (필수) -->

 <script
 src
= ".../plugins/gc.spread.report.reportsheet.min.js"
 ></script>
  window. onload
= async
() => {
 const
spread = new
GC.Spread.Sheets.Workbook(document.getElementById( 'ss'
));

 // 내보낸 리포트 JSON 파일 로드 (이동시킨 경로에 맞춰 설정)

 const
res = await
fetch( './assets/templates/report_template.ssjson'
);
 const
reportData = await
res.json();
SpreadJS 리포트 시트 기능 구축 완료!
이제 SpreadJS의 Excel 시트 기반 "리포트시트(ReportSheet)" 환경이 구축되었습니다.
기업의 다양한 데이터를 연동하여 Excel 기반의 기업 보고서, 각종 증명서, 서식을 쉽고 빠르게 만들고 배포해 보세요.
See the Pen [포럼] 리포트 시트 시작하기 by Mescius Korea ( @MESCIUS-Korea) on CodePen.
Diverse Enterprise Business Features Powered by SpreadJS
Explore the Business Excel Add-Ons for SpreadJS
SpreadJS provides Excel-based features tailored to diverse enterprise business needs, enabling fast and efficient development of even the most complex business systems.

Excel Editor
Deliver a complete web Excel editor built on HTML5 and JavaScript to your end users.
-
Full Excel Compatibility A web editor that is fully compatible with existing Excel files.
-
Familiar UI/UX Excel menus and interface your users already know
-
Powerful Customization JS Excel library and API support for editor customization

Real-Time Collaboration
Build an environment where multiple users can collaborate on a single sheet simultaneously.
-
Server Framework Build a stable Collaboration server based on Node.js
-
Real-Time Collaboration Multi-user simultaneous input with live user action and cursor display
-
Conflict Prevention Precise conflict control and permission management powered by OT engine

AI Assistant
Maximize productivity with natural language formula generation and data analysis.
-
Multi-AI Model Support Connect with OpenAI, Gemini, Claude, and custom in-house AI
-
Natural Language Command Generate and explain Excel formulas and auto-build pivot tables
-
Excel AI Functions Dedicated AI function library for data analysis

Pivot Table
Quickly summarize large volumes of Excel data and extract insights.
-
Excel-Like Experience Bring the same pivot UI and usability as Excel to the web
-
JS Control Set Custom controls for pivot UI customization
-
View Manager Save and load per-user pivot analysis views

Gantt Sheet
Integrate project scheduling and resource management into your Excel sheet.
-
Project Management Full support for timescales, task bars, calendars, and more
-
Data Binding Easy data binding via DataManager
-
Flexible Compatibility Import/export support based on Excel and JSON

Data Chart
Visualize Excel data and create intuitive dashboards.
-
Dashboard Designer A dedicated designer for building Excel dashboards without coding
-
Diverse Charts Support for various Excel chart types with real-time data updates
-
Easy Binding Fast and simple JSON data connection via DataManager

Ask Anything!
Share your questions and concerns about SpreadJS with the MESCIUS expert team. We are here to listen and help.
Experience the SpreadJS ReportSheet Right Now
Easily design recurring reports and custom forms with SpreadJS ReportSheet, and automate your data integration all in one place.