80+ High-Performance JavaScript Charts for Enterprise Apps
The world's most high-performance, scalable, and independent JavaScript data grid, recognized by developers worldwide.
- Full support for popular Angular, React, and Vue.JS
- Support for dozens of chart properties and options
- Support for various special charts

Ask Anything!
Share your vague concerns and questions about Spread.NET with MESCIUS's expert team. We empathize with your concerns and are here to help.
JavaScript Bar Chart
-
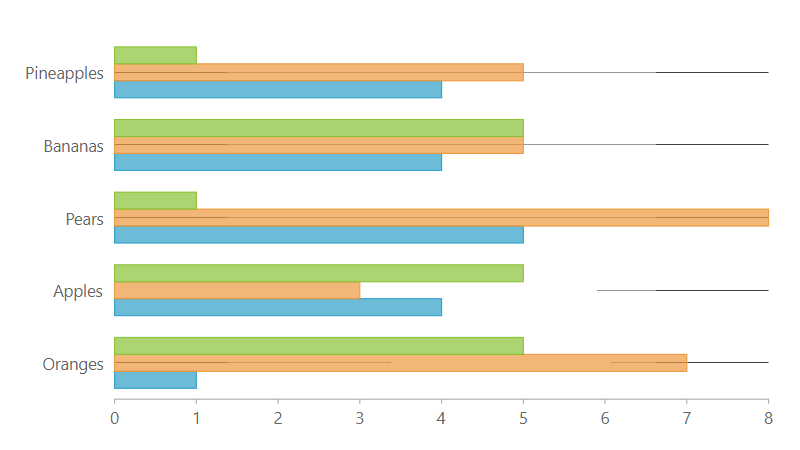
Horizontal Bar
Implement multiple data series, animations, selections, and tooltips within a basic horizontal bar chart with your mouse.
Demo -
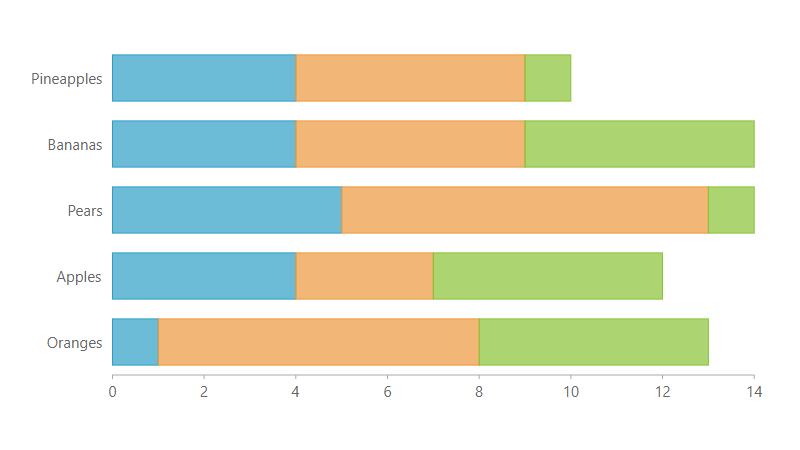
Cumulative Bar
Stack data points in a JavaScript bar chart. Use horizontal bars to plot data points on top of each other.
Demo -
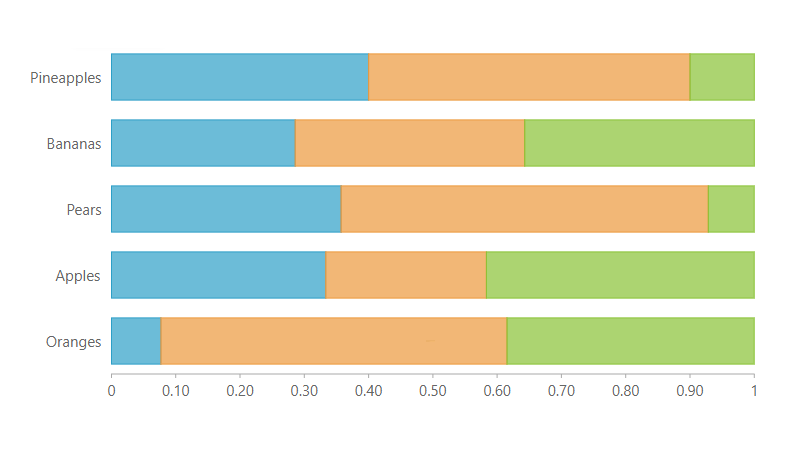
100% Cumulative Bar Chart
Compares the percentage that each value contributes to the total. The cumulative percentages for each column always add up to 100.
Demo -
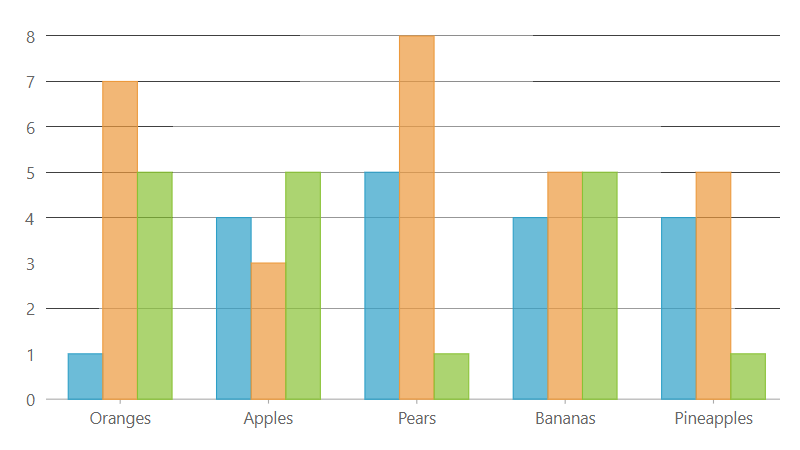
Vertical Bar
Similar to a bar chart, which primarily uses vertical orientation, JavaScript column charts use vertical bars to compare values across categories.
Demo -
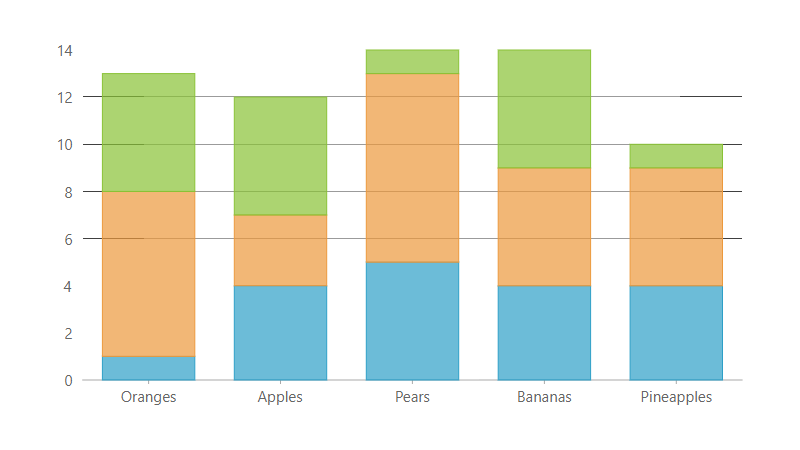
Stacked Vertical Bar
Stack and plot data points on a column chart using vertical bars. To stack chart values, set the FlexChart stacking property.
Demo -
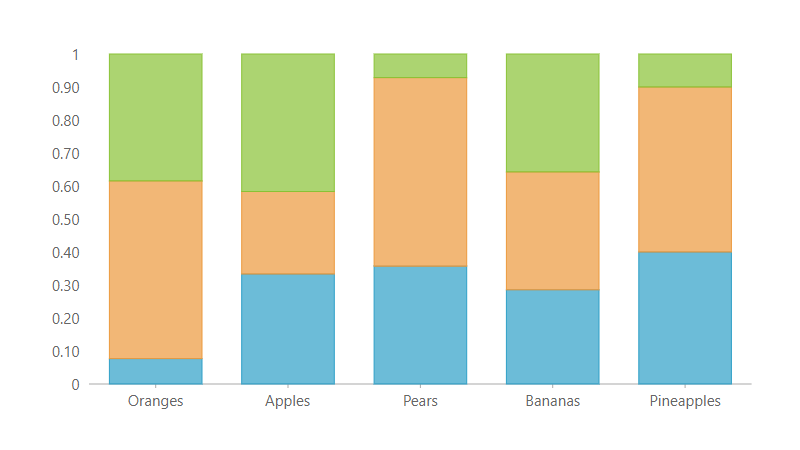
100% Cumulative Vertical Bar
The cumulative percentages for each column always add up to 100. Compare the percentage that each value contributes to the total.
Demo
JavaScript Line & Area Charts
-
Line chart
Use basic JavaScript line charts to display changes in short-term and long-term data and work well with large amounts of data.
Demo -
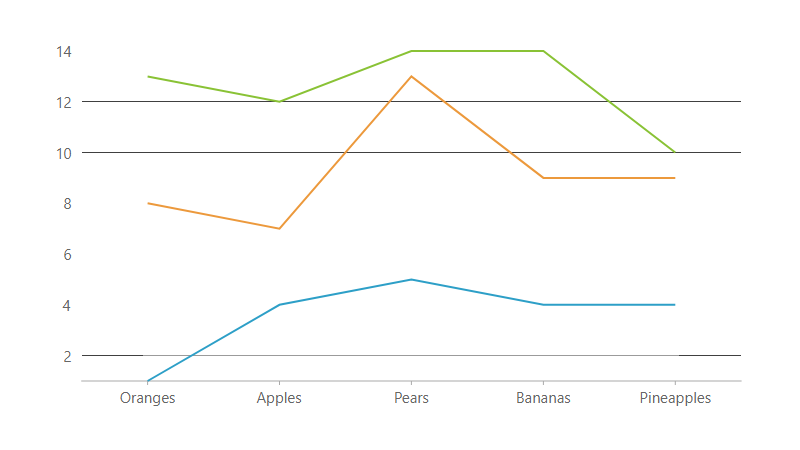
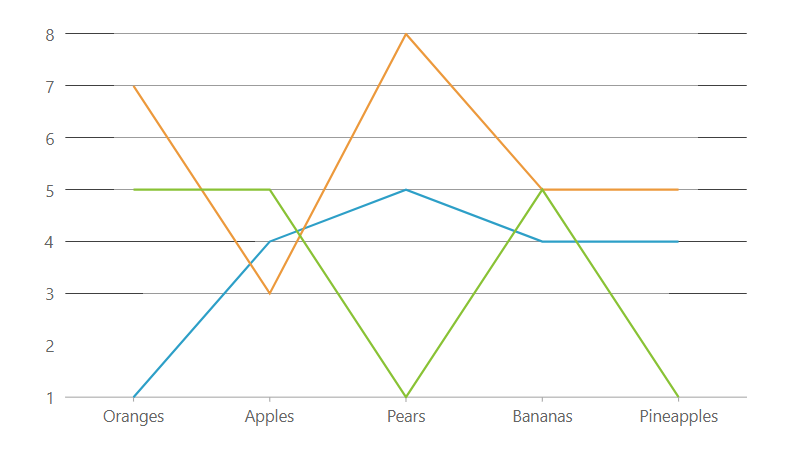
Stacked Line Chart With Line Markers
Stacks a series on a line chart. A stacked line chart is a line chart where the lines do not overlap because they accumulate at each point.
Demo -
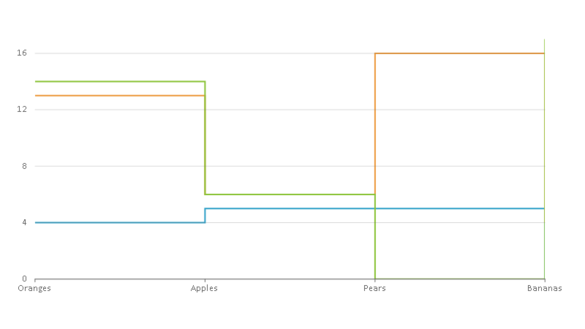
StepLine Chart
StepLine charts help visualize changes at specific points. Data points are connected by vertical and horizontal lines.
Demo -
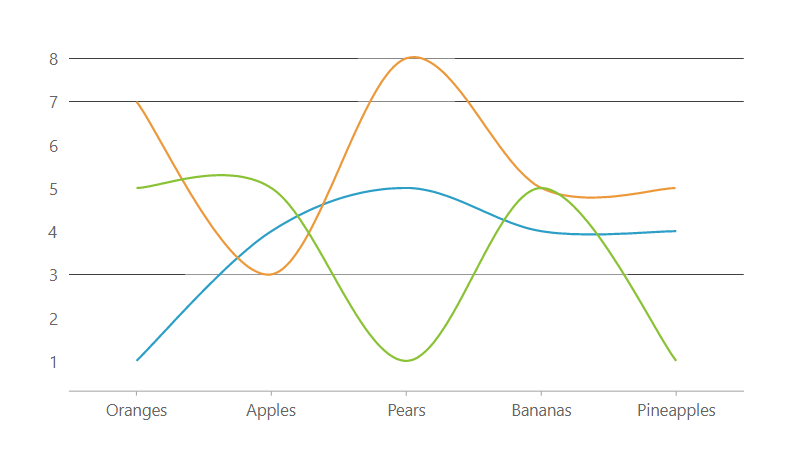
Spline Chart
Spline charts connect data points with smooth lines and plot data using numeric, categorical, date/time, or logarithmic axes.
Demo -
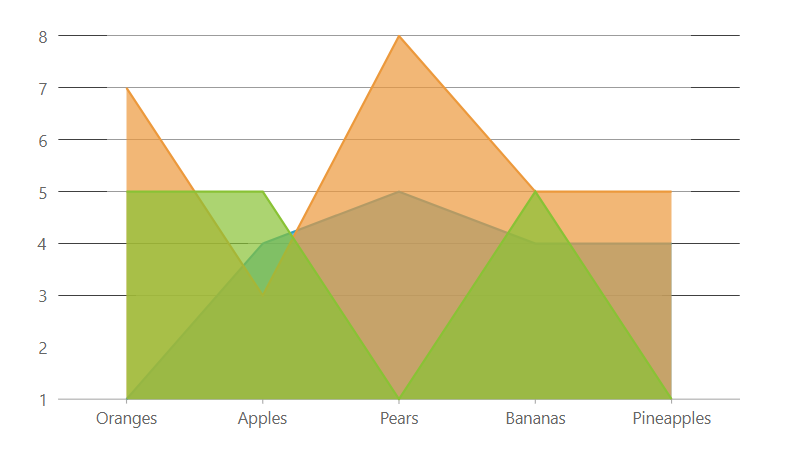
Area Chart
Represents time-dependent data to reflect trends at equal intervals, but fills the area below the line to show trends in similar categories.
Demo -
Range Area Chart
Fill in the area below the line to show trends in similar categories. This shows changes in data values over a specified period of time.
Demo
JavaScript Scatter & Bubble Charts
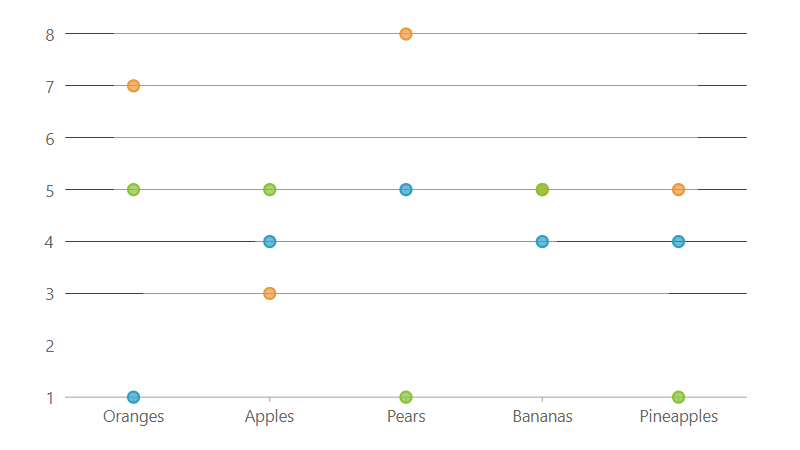
XY Scatter Plot Chart
Shows the correlation between data points and a series of numeric data along the x-axis and y-axis. Scatter charts combine values into a single data point and display uneven spacing, or clusters.
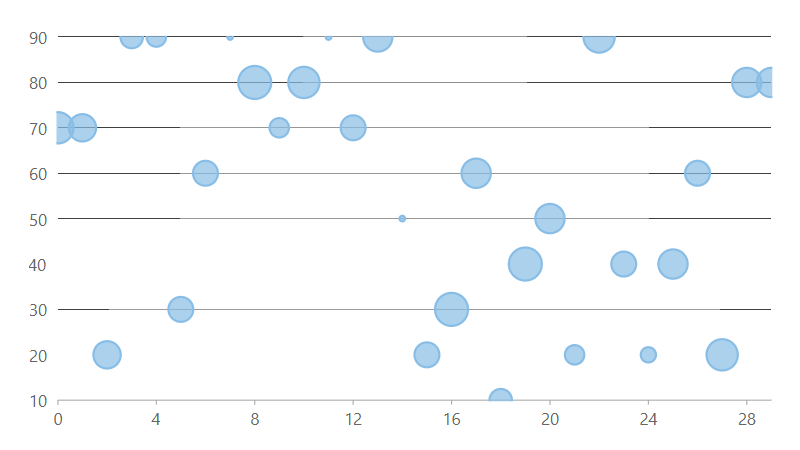
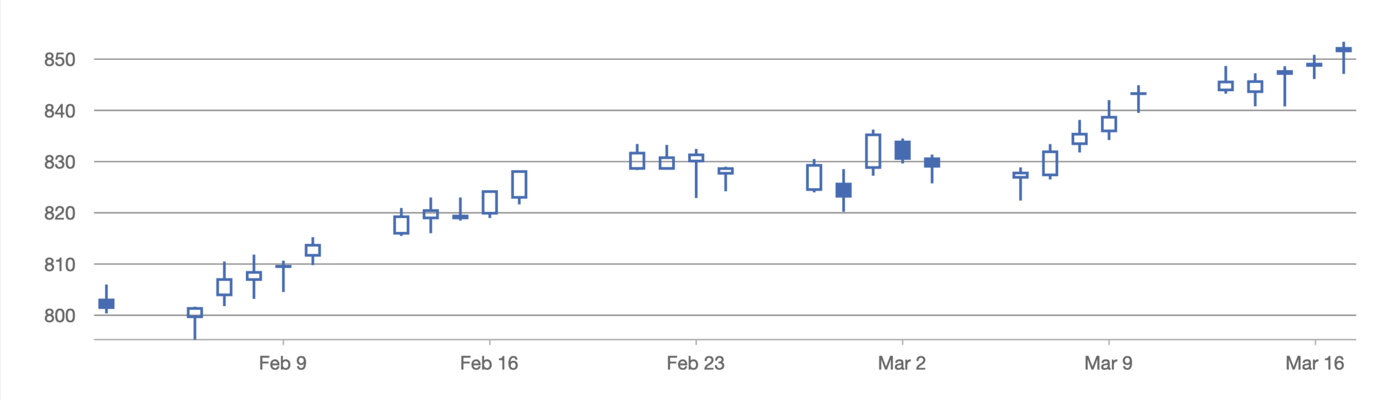
Bubble Chart
Create rich and visually appealing data modeling and financial charts using bubble charts. This JavaScript Flexchart type allows you to display data series as a set of symbols of varying sizes in the chart space.
JavaScript Pie & Sunburst Charts
-
-
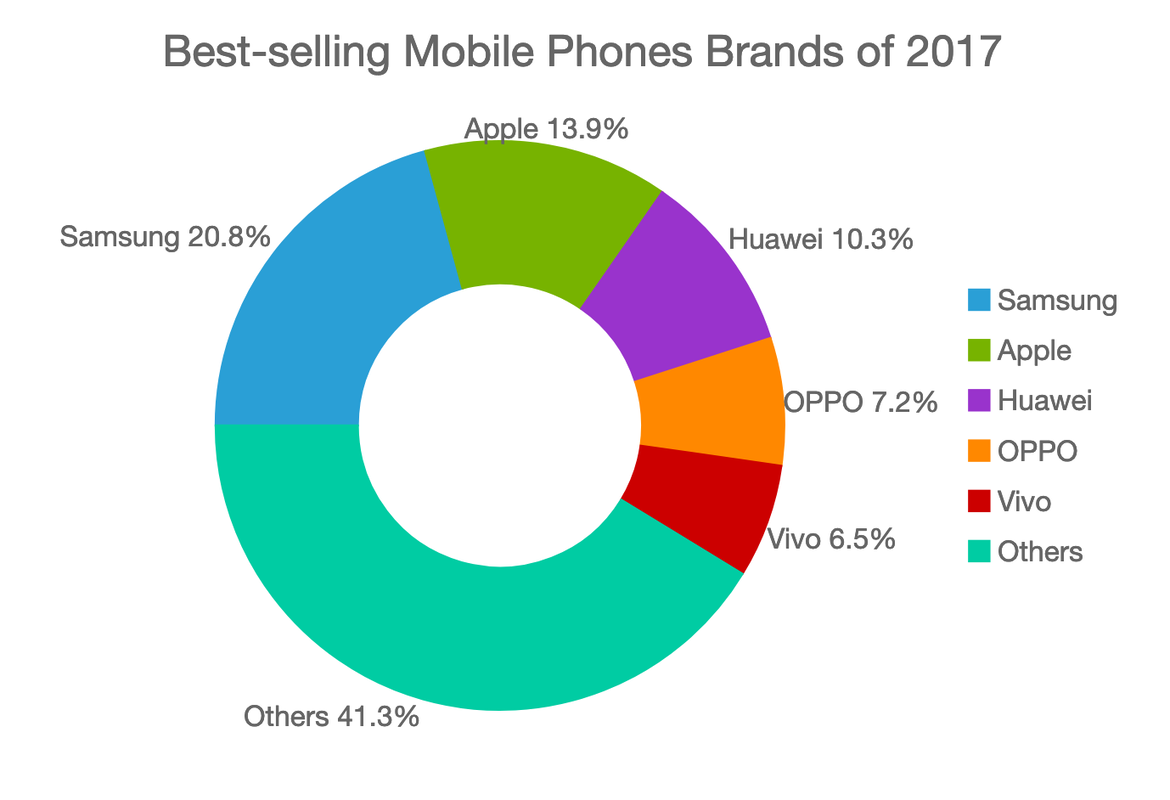
Donut Chart
Set the inner radius property of a JavaScript pie chart to create a donut shape. Includes all pie chart customizations.
Demo -
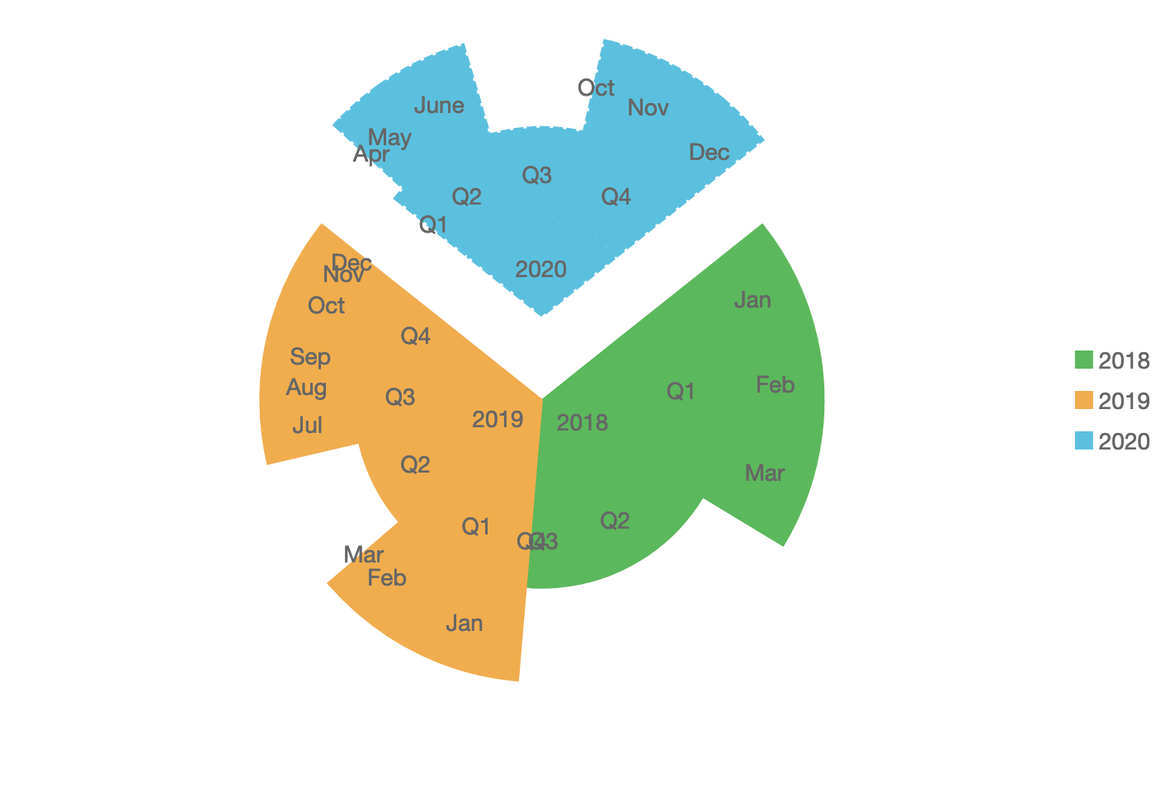
Sunburst Chart
Visualize hierarchical data from the root node (center) outward, with subordinate layers. The inner circle segments are the parents of the outer circle segments within the upper angular sweep.
Demo -
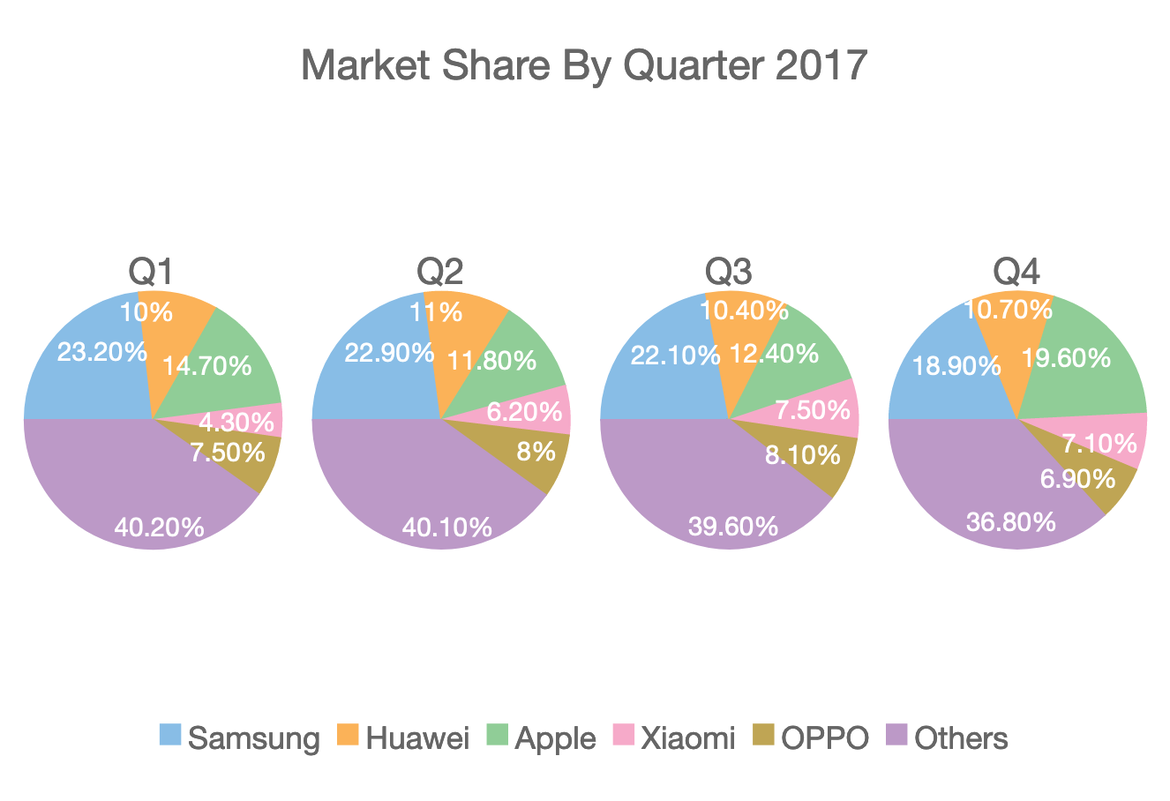
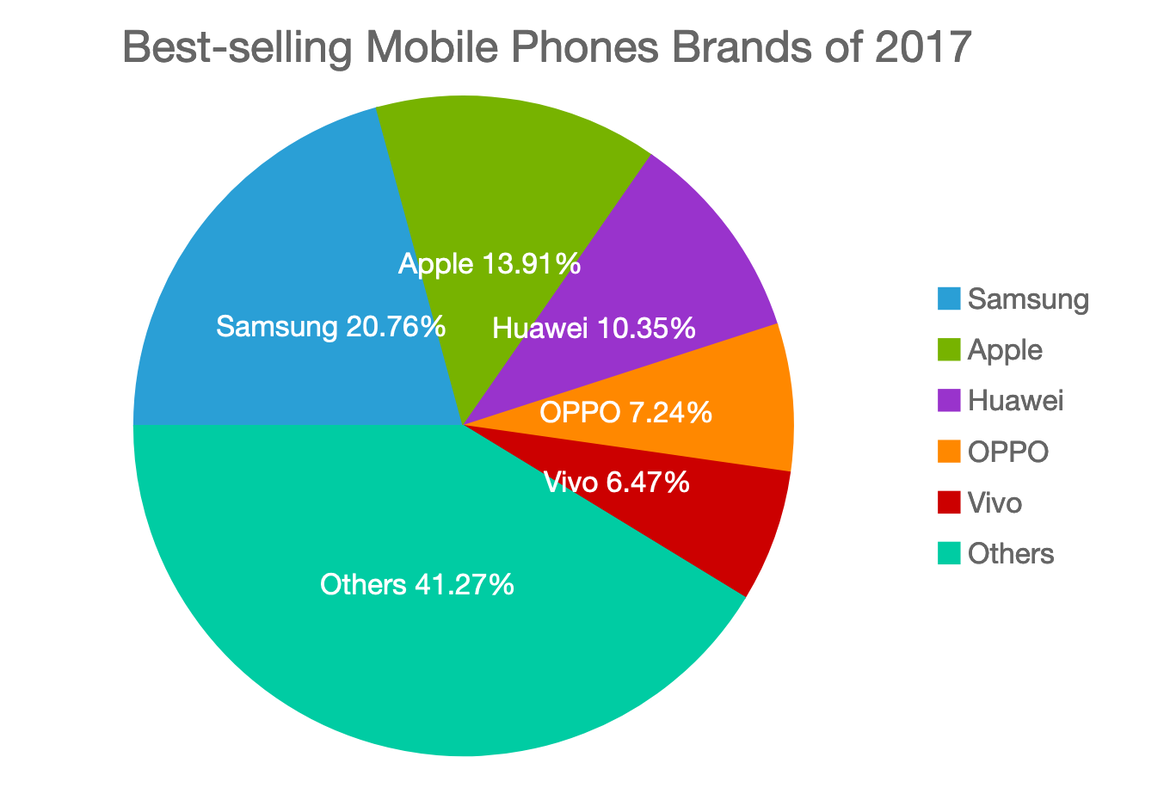
Multi-Pie Chart
Using FlexPie, you can create multiple pie chart "series" using the same data source to visualize more data in a single chart. This is an effective way to present data, especially when your goal is to show a section relative to the whole.
Demo
JavaScript Radial & Polar Charts
-
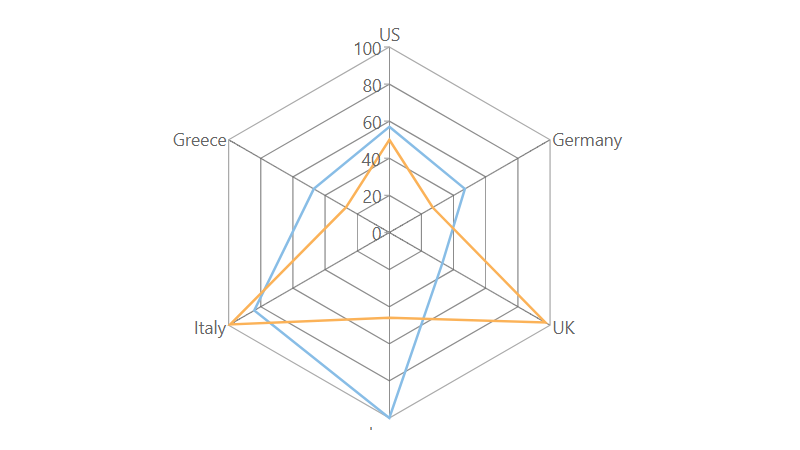
Radial Chart
Displays multivariate observations with any number of variables. JavaScript radar charts visualize data in terms of values and angles.
Demo -
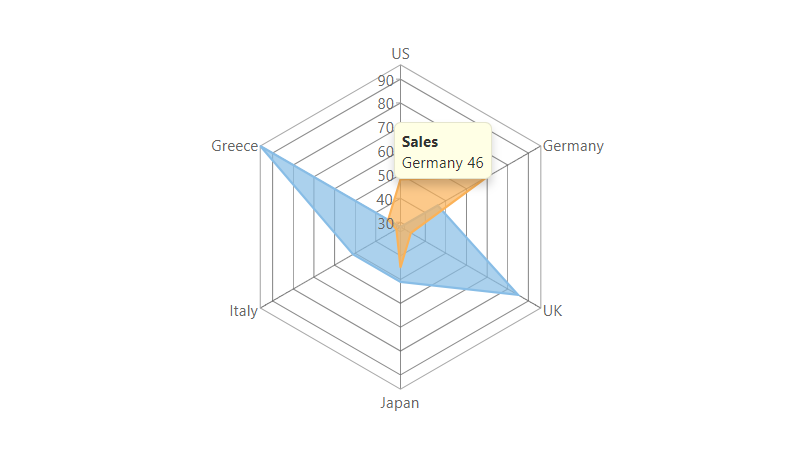
Filled Radial Chart
Filling the area between the lines of a basic radar chart, the FlexRadar control fills the chart sections and sets the Chart Type property to Area to visualize data in terms of values and angles.
Demo -
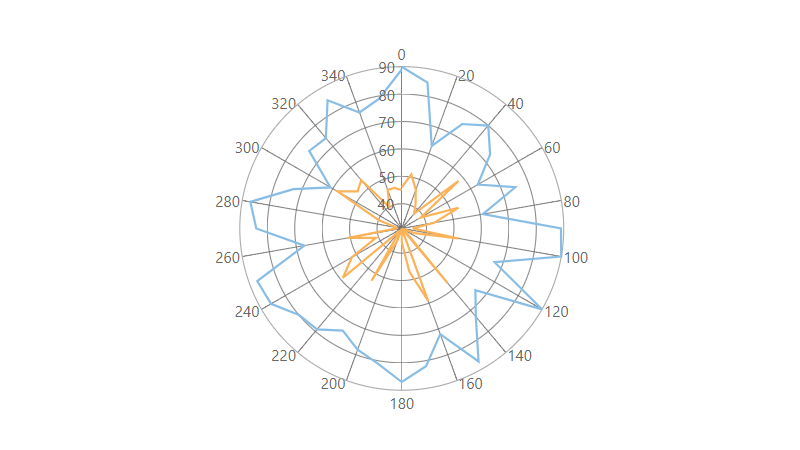
Polar Chart
Create a pie chart to display multivariate observations with any number of variables. Visually compare multiple quantitative or qualitative aspects of a situation.
Demo
JavaScript Special Charts
-
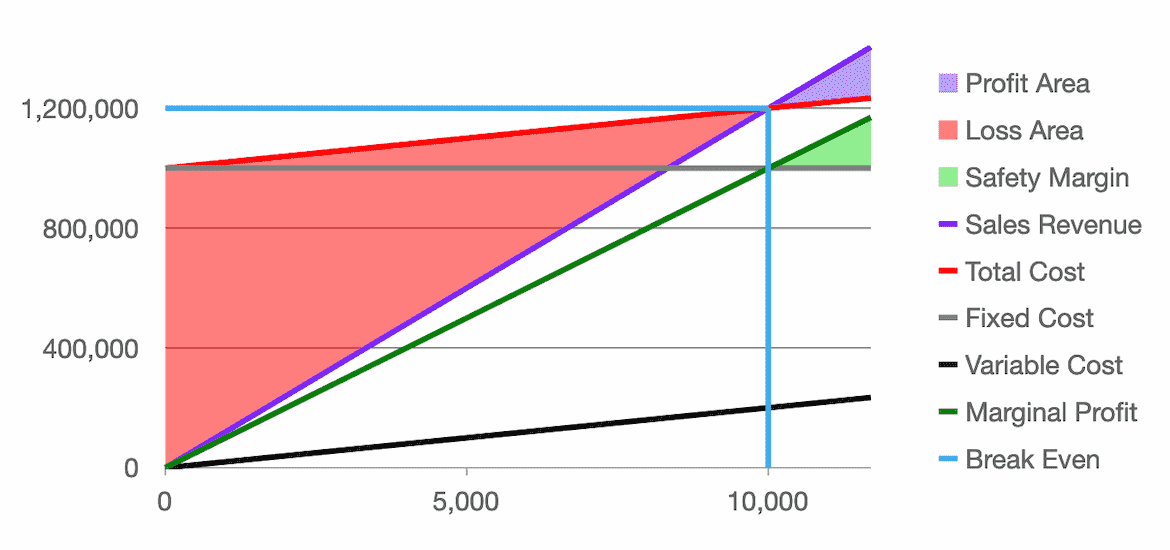
Break-Even Chart
The break-even chart shows the sales volume at which total costs equal sales volume. The vertical axis of the chart displays revenue, fixed costs, and variable costs, while the horizontal axis displays volume.
Demo -
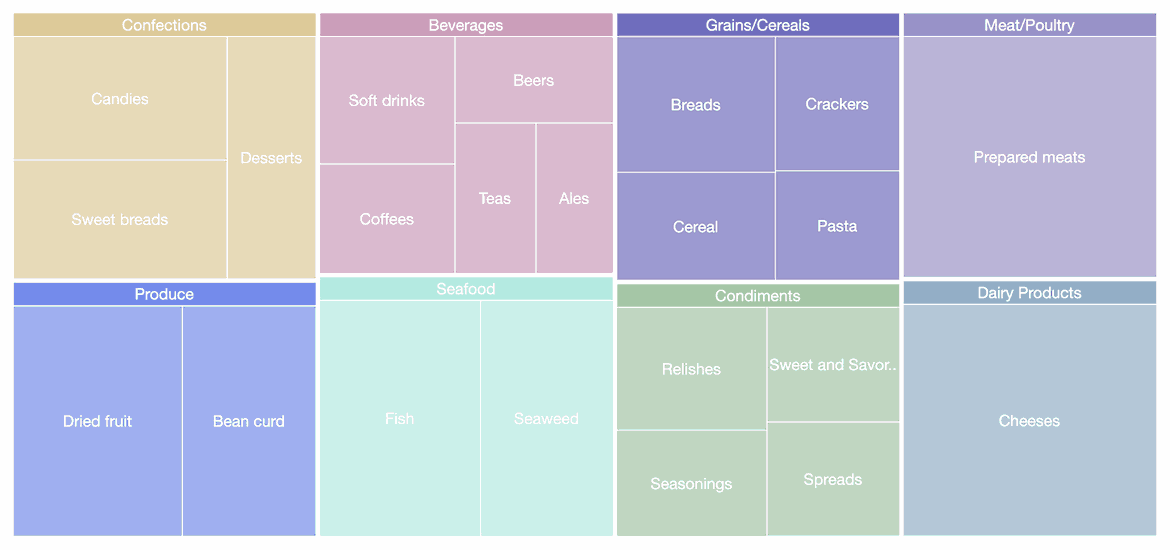
Grouped TreeMap Chart
Displays hierarchical information combined with relative quantities. It highlights hierarchical tree-structured data as a set of nested rectangles, helping to analyze anomalies in the data set.
Demo -
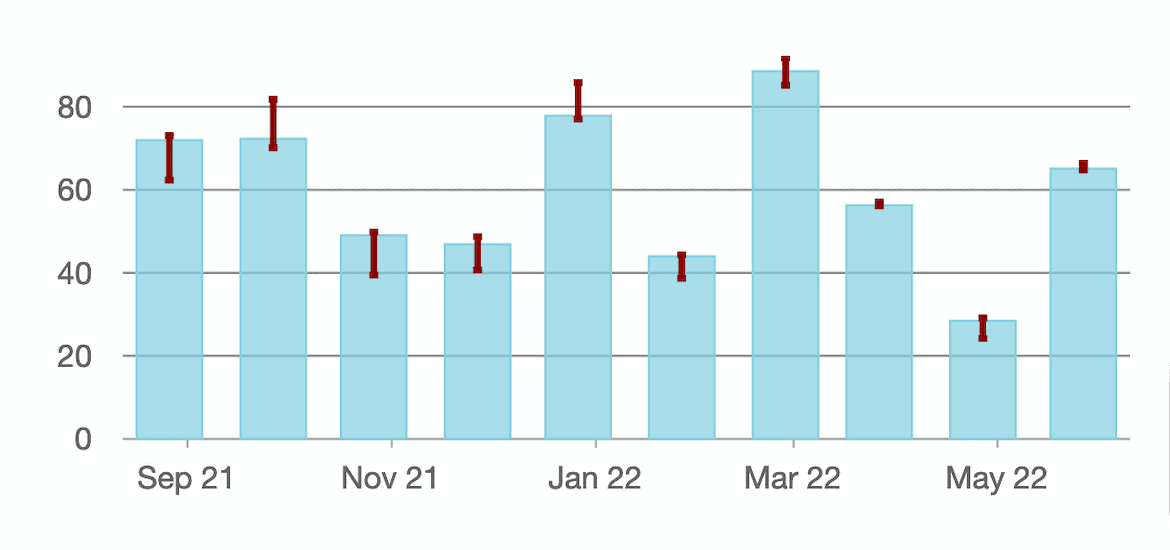
Error Bar Chart
Graphically represent the variability of data to indicate measurement uncertainty. "Error" is not a mistake, but rather a range of data that represents inherent uncertainty.
Demo -
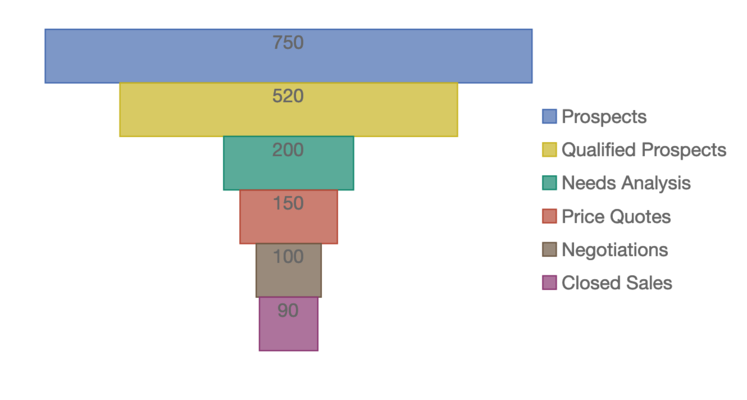
Funnel Chart
Visualize the stages of a process, such as sales, in a funnel shape. Plot streamlined data to illustrate the various stages of the process. Use the optional properties to adjust the height, width, and style of the funnel.
Demo -
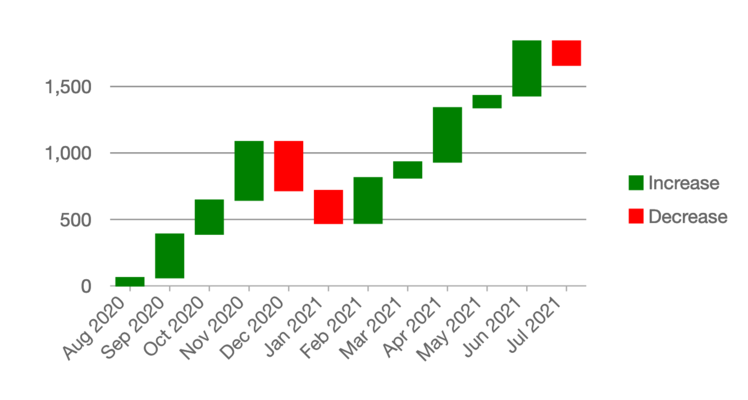
Waterfall Chart
A waterfall chart shows changes in the starting position of a chart over a series of changes. A waterfall chart is a form of data visualization that helps you understand the cumulative effect of sequentially introduced positive or negative values.
Demo -
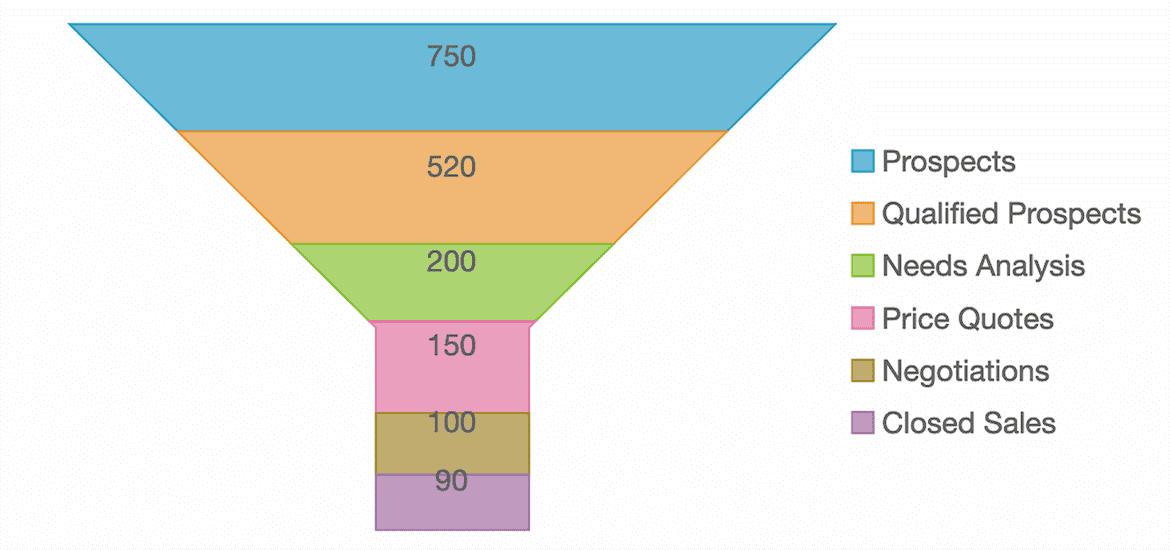
Square Funnel Chart
Create a funnel with square edges for a different shape that plots simplified data to show the various stages of the process. Use a funnel chart to display the number of sales prospects at each stage of the sales funnel.
Demo -
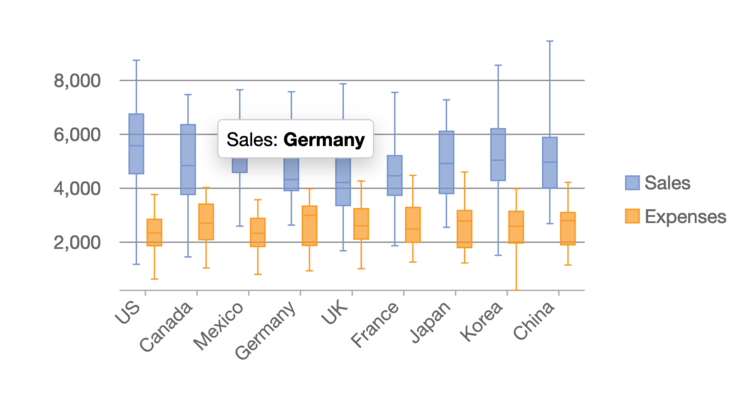
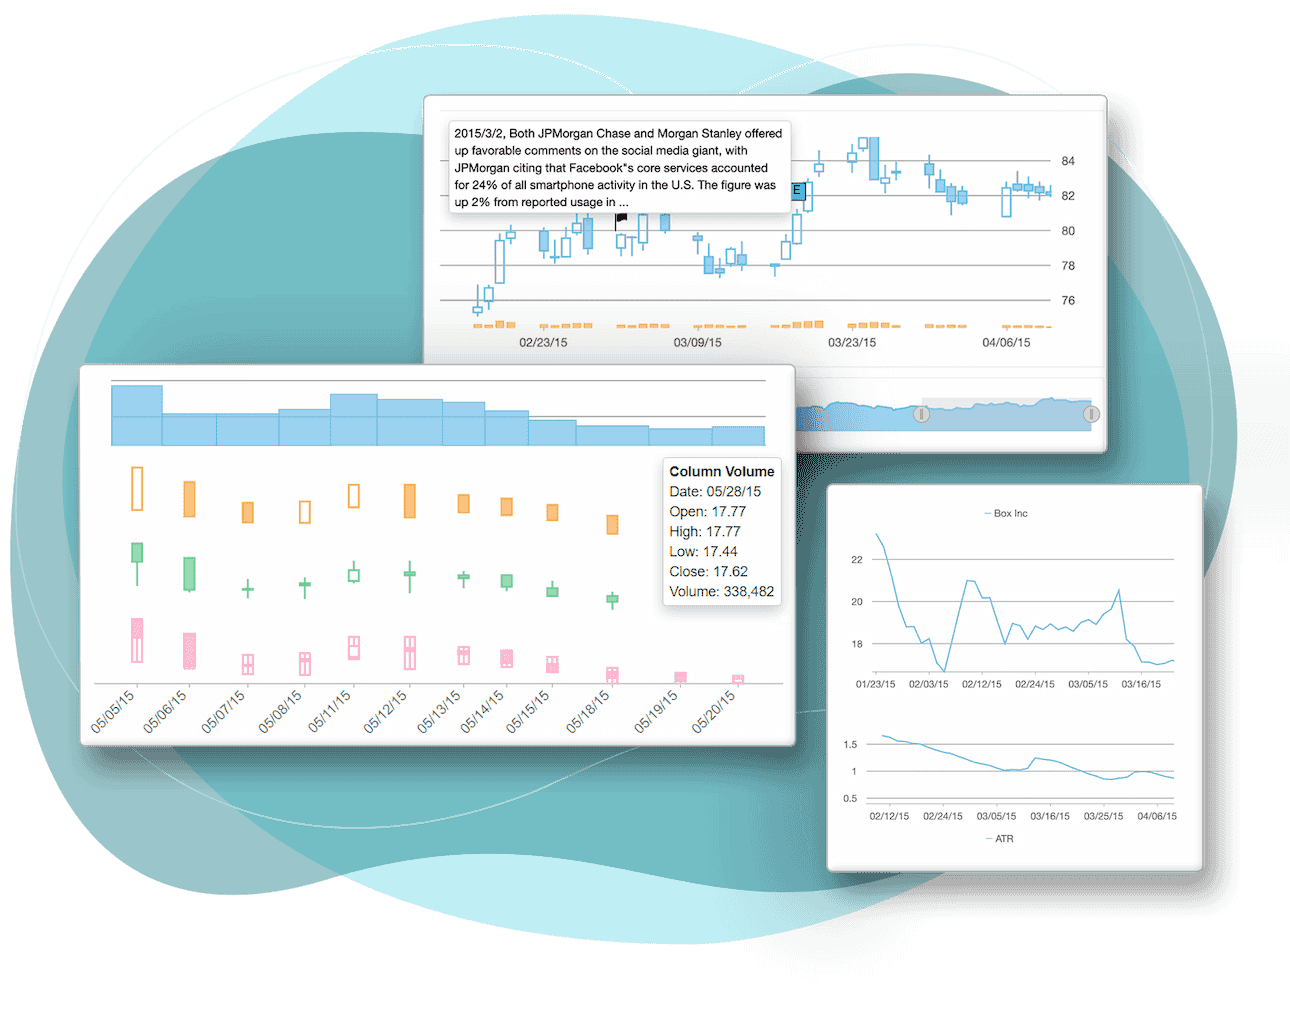
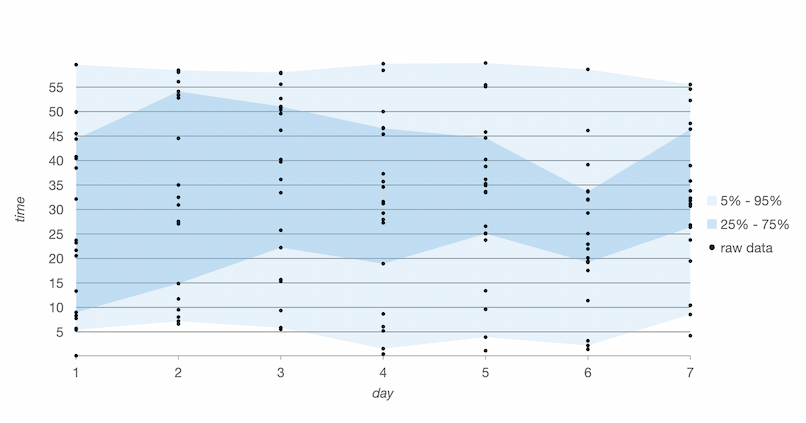
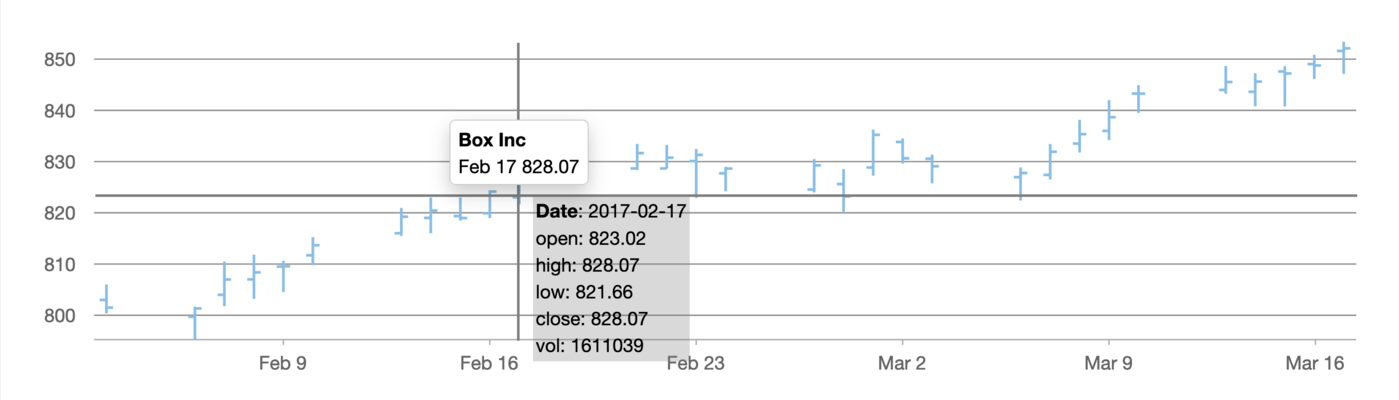
Box-and-Whisker Chart
Visualize groups of numerical data using quartiles. Boxplots may have vertical lines extending from the boxes, indicating variability outside the upper and lower quartiles.
Demo -
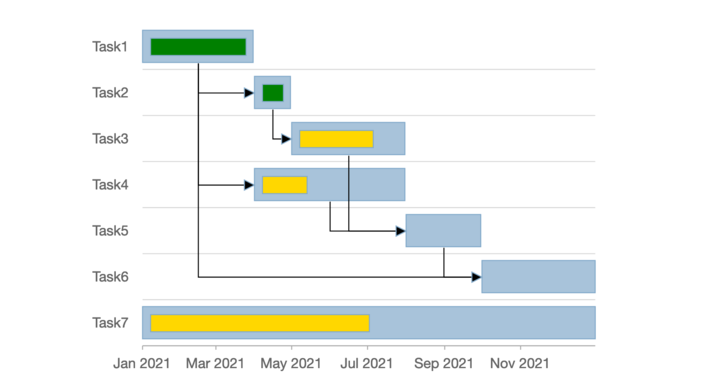
Gantt Chart
Manage your projects with a Gantt chart and never miss a step. It includes information such as dependencies and completion percentages, start and end dates for each task, completion status, and task dependencies.
Demo

Ask Anything!
Share your vague concerns and questions about Spread.NET with MESCIUS's expert team. We empathize with your concerns and are here to help.
Wijmo Tutorial
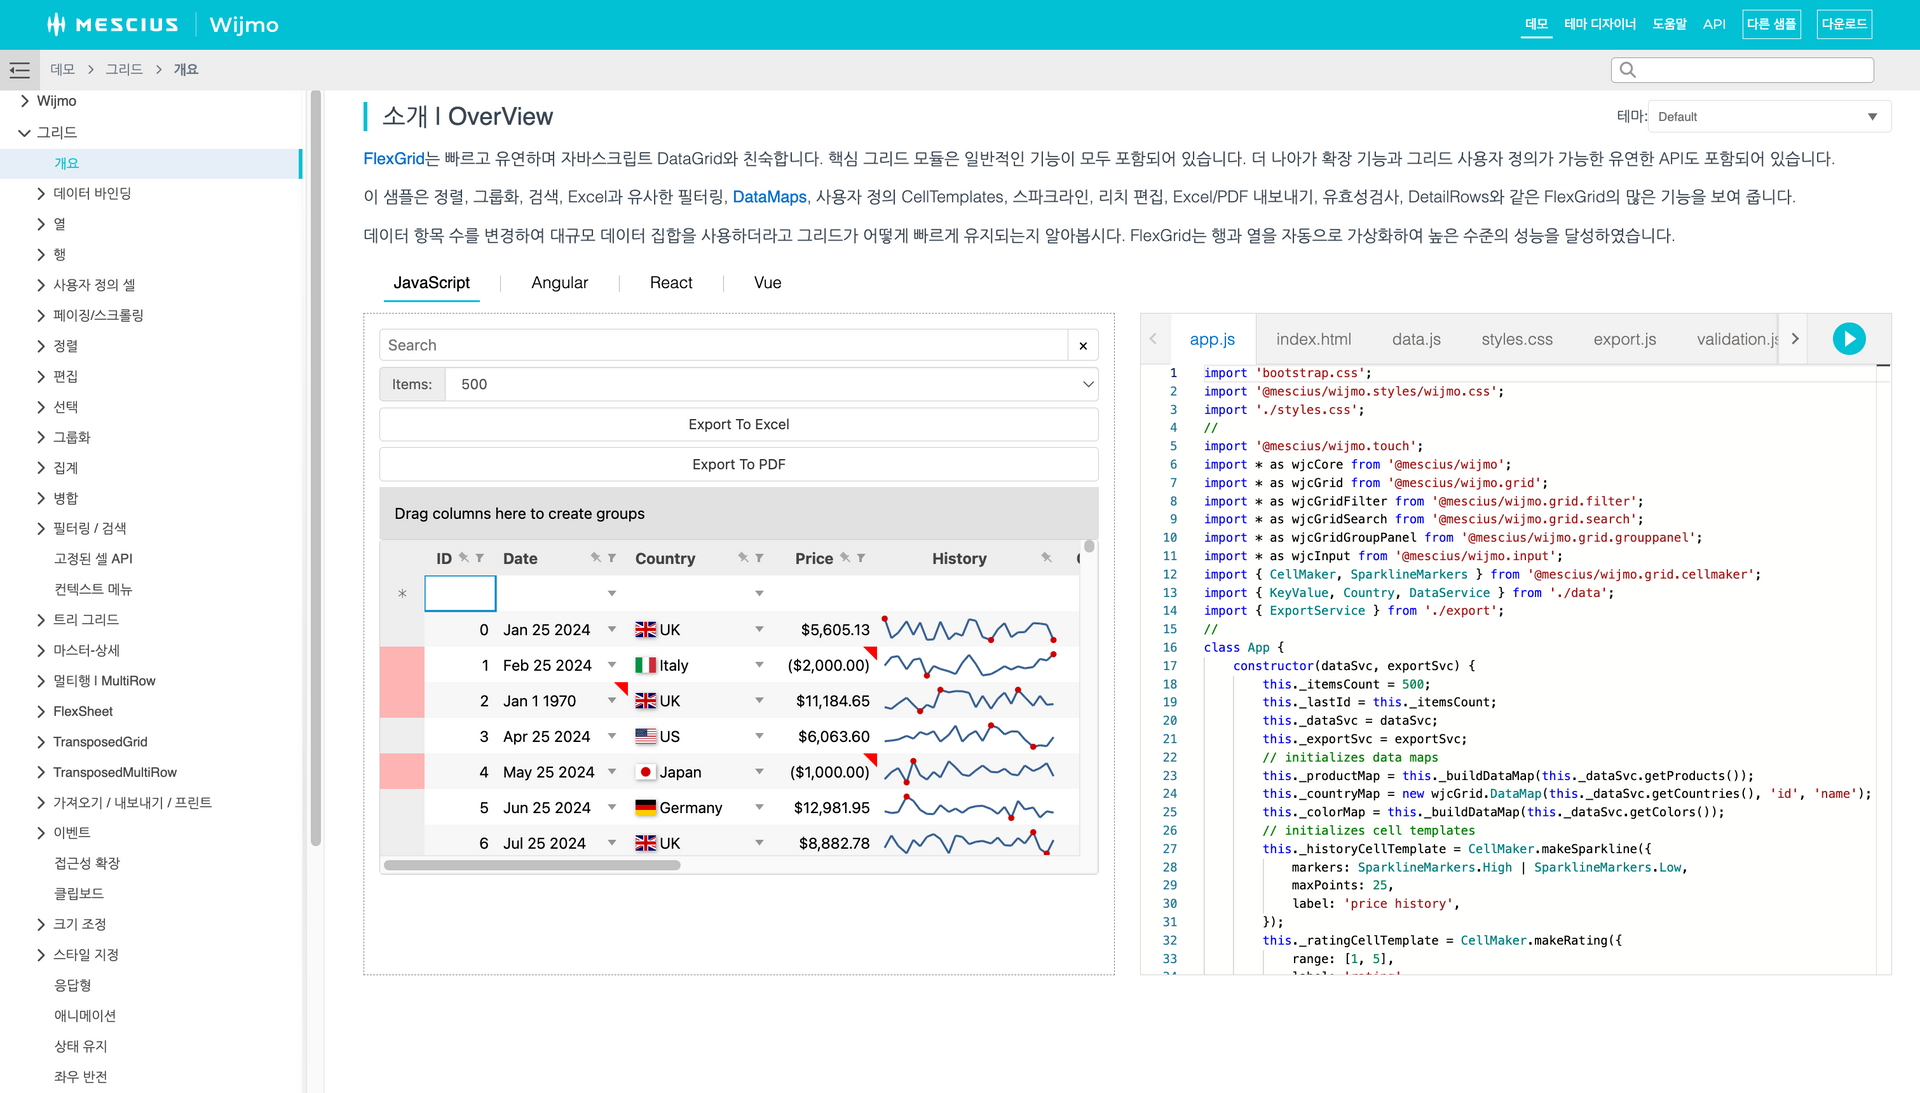
You can check out the demo and learn how to implement it in practice through the tutorial.
Provides code for Angular, React, and Vue frameworks.


Easily Customize Wijmo Controls!

Easily create design themes using the Wijmo CSS Theme Designer and apply the created CSS to your Wijmo controls!

Easily customize the settings of Wijmo controls using the Wijmo Control Properties Editor. You can modify and check the settings for over 20 different controls. Download these settings and quickly and easily apply them to your web without any additional coding.
MESCIUS Developer Forum
-

Wijmo Blog & Tips
We provide various information to help you use Wijmo effectively.
-

Wijmo Q&A
Please share your concerns and development knowledge with us through the Q&A space.
-

Wijmo FAQ
You can check answers to frequently asked questions.
-

Citizen Insight
This space was created to help alleviate some of the fatigue and stress you may experience while working. Feel free to communicate freely.
-

Citizen Knowledge
In addition to questions about MESCIUS products, this is a space where anyone can freely ask questions and communicate about development/technology.
-

IT Seminar/Meeting
This is a meeting space created for developers and those interested in development to develop together.


Purchase Procedure
Click on each button to see detailed information about each step of the purchasing process.
Controls for Web Developers
SpreadJS
Pure JavaScript-based Web-Excel Component
- Supports Excel import/export
- Supports 450 Excel functions
- Supports Angular, React, and VueJS
Learn More
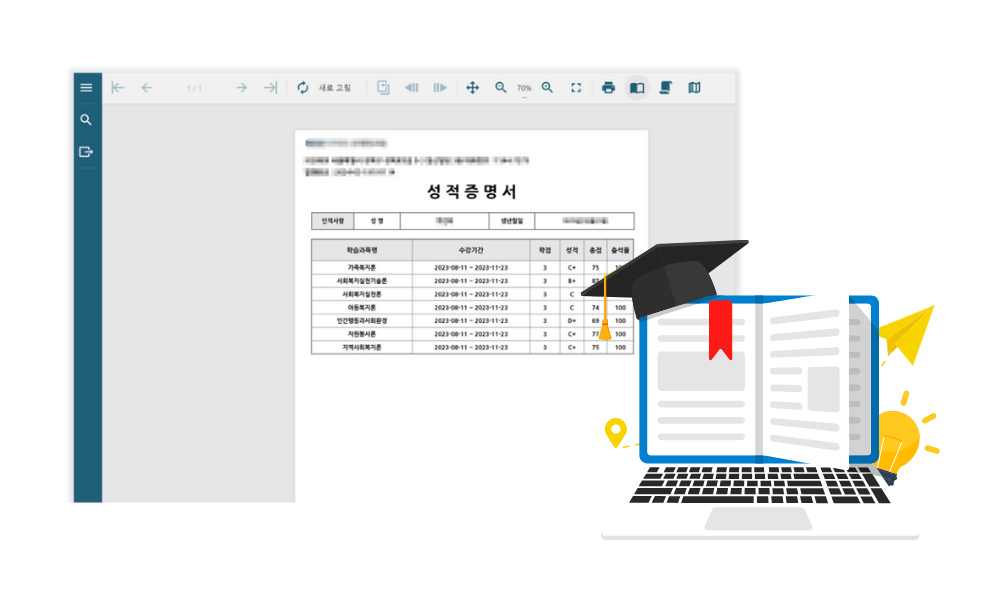
ActiveReportsJS
JavaScript-based Business Reporting Component
- Supports Angular, React, and Vue
- Provides a cross-platform designer program
- Provides a JavaScript report viewer
Learn More
Forguncy
Build Business Web Apps with Excel — No Coding Needed
- Turn Excel features into fast, powerful web apps
- Start web development — no HTML or CSS required
- Unify and collect your business data with ease
Learn More
DsExcel
High-Performance Excel Spreadsheet API for Java, Kotlin, and .NET
- Create, load, edit, and save spreadsheets
- Parse, convert, and share spreadsheets
- Calculate formulas and format cells
DsExcel JavaDsExcel .NET