Why Wijmo
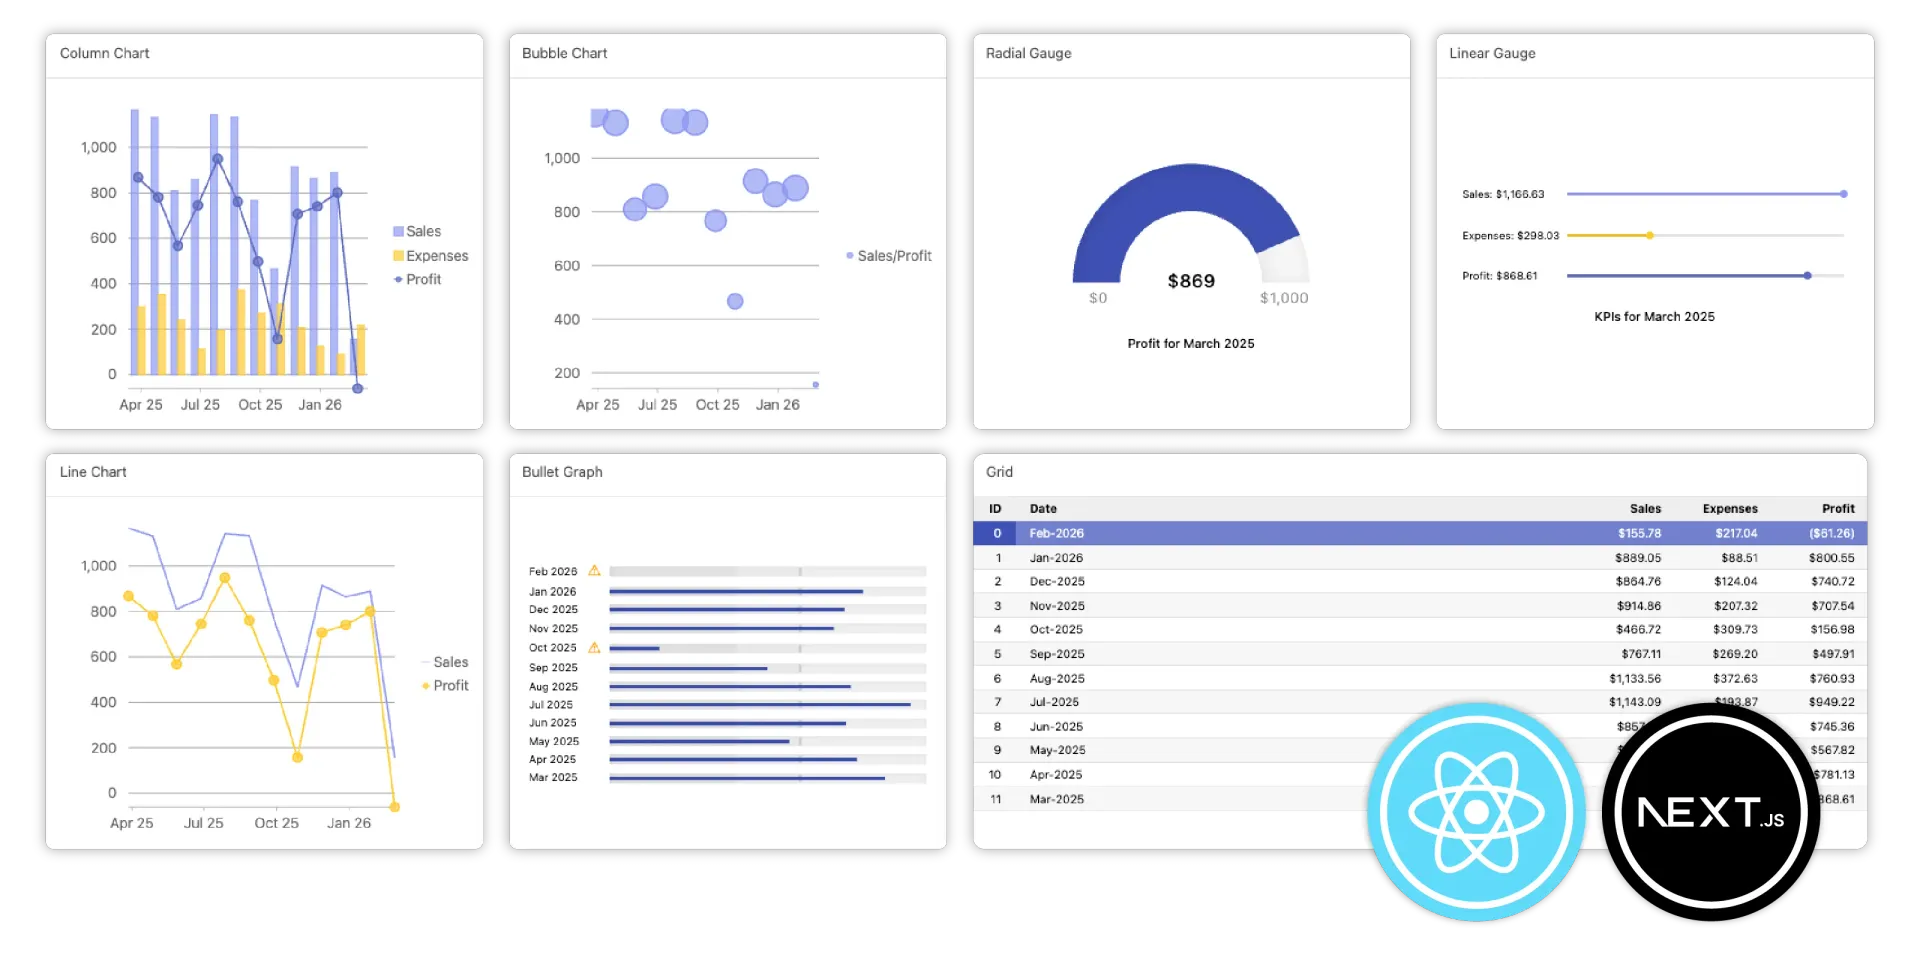
Why Choose Wijmo for Next.js App?


Quick Start
Getting Started with Wijmo in Next.js 🚀
* The guide below uses Next.js 14.2.5
1. Go to the Next.js app folder and install the Wijmo library.
When using Wijmo in Next.js, you use Wijmo components for React.
npm install @mescius/wijmo.react.all
2. Create a folder and file to load the Wijmo library.
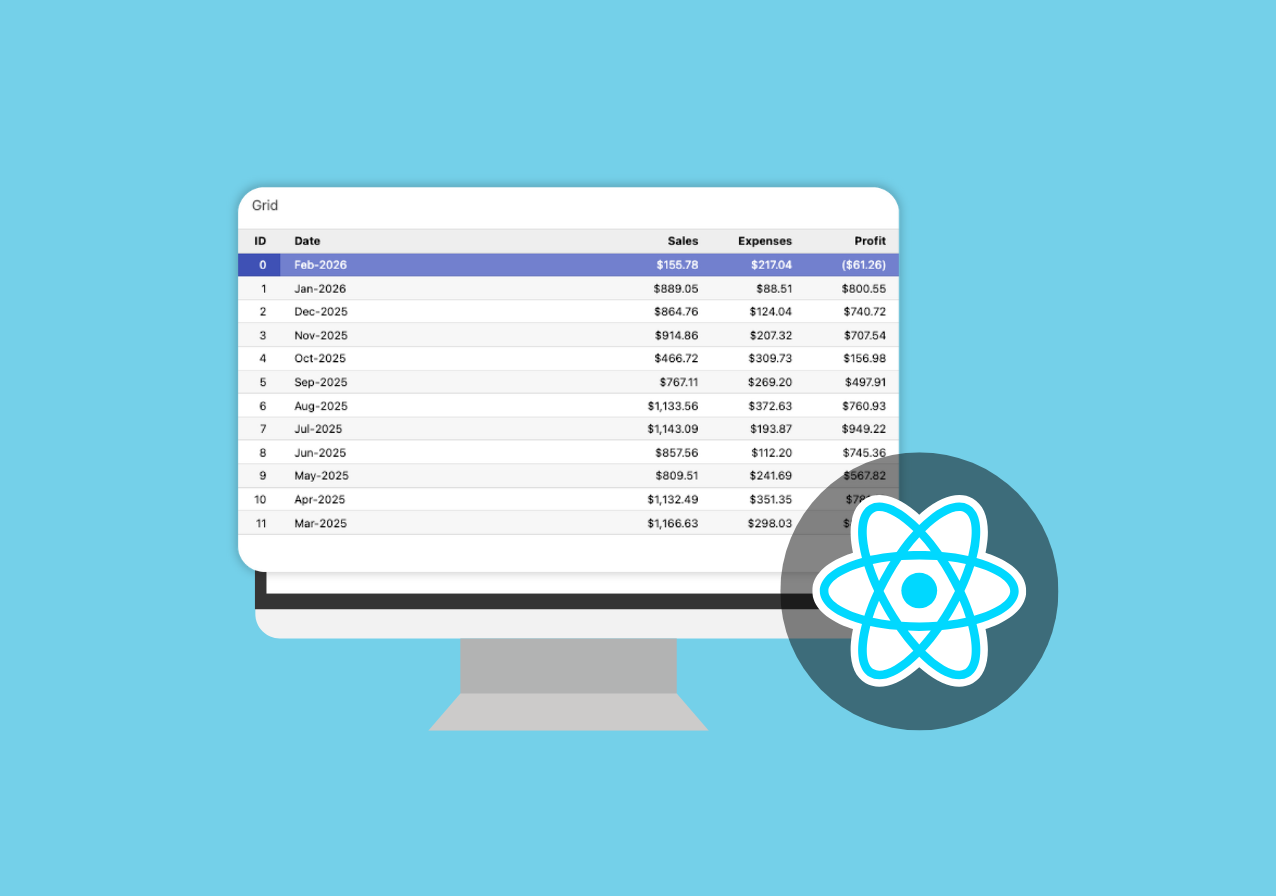
This article explains how to set up Wijmo's FlexGrid control.
If you would like to add other controls, please check the detailed code samples for each control below.
Create a "components" folder in the root folder of your project, then create a FlexGrid.tsx file in that folder.
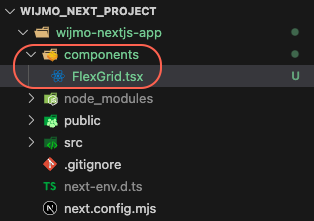
3. Wijmo does not support server-side rendering (SSR), so configure the component to render only on the client side.
Add the following directive to the components/FlexGrid.tsx file:
'use client';
4. Add css file to apply Wijmo style.
Add the Wijmo css file to the components/FlexGrid.tsx file.
import '@mescius/wijmo.styles/wijmo.css';
5. Add the Wijmo modules you want to use.
Add the Wijmo module as follows:
Please check the sample below for detailed code for each control.
import * as { namespace } from '@mescius/wijmo.react.{control name}' ;
6. Initialize the Wijmo control and add it to the screen.
After initializing the Wijmo control and generating sample data, we write code to display the Wijmo control on the screen.
Please check the detailed code for each control in the sample below.
-
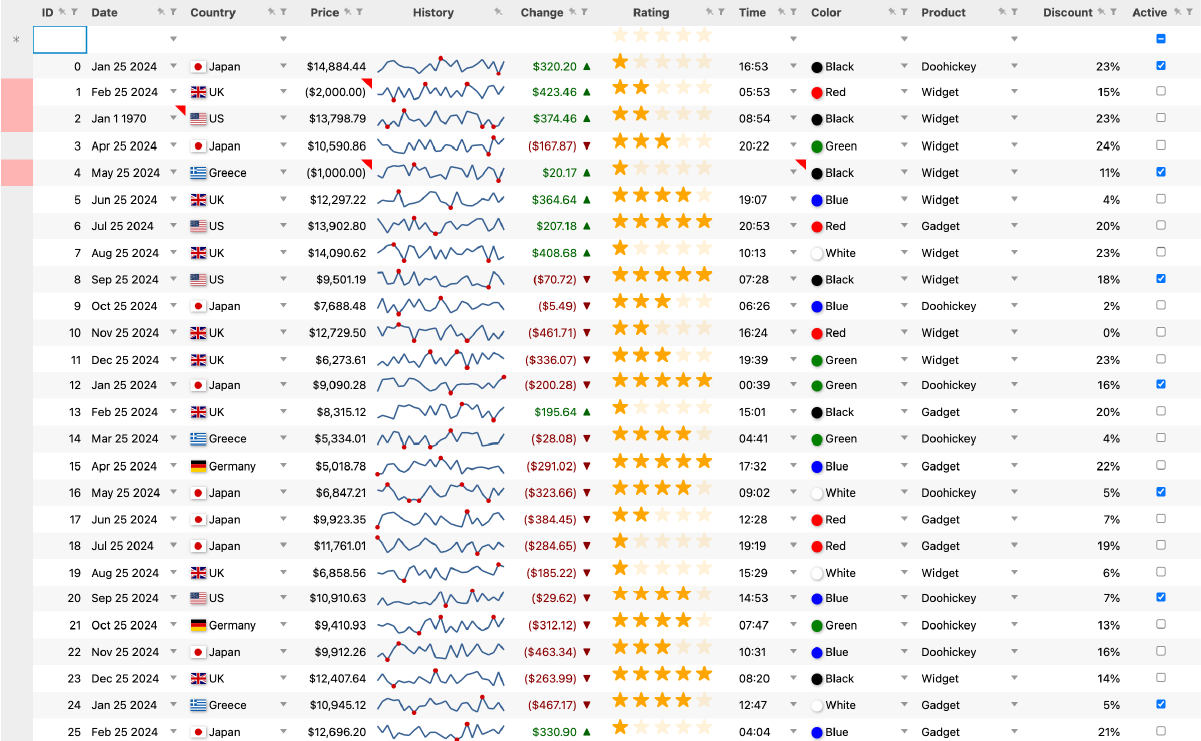
Below is the code to add the FlexGrid module.
import * as wjGrid from '@mescius/wijmo.react.grid';<Preview>
Click the button below to view the full code sample.
Run Online Sample 🖥️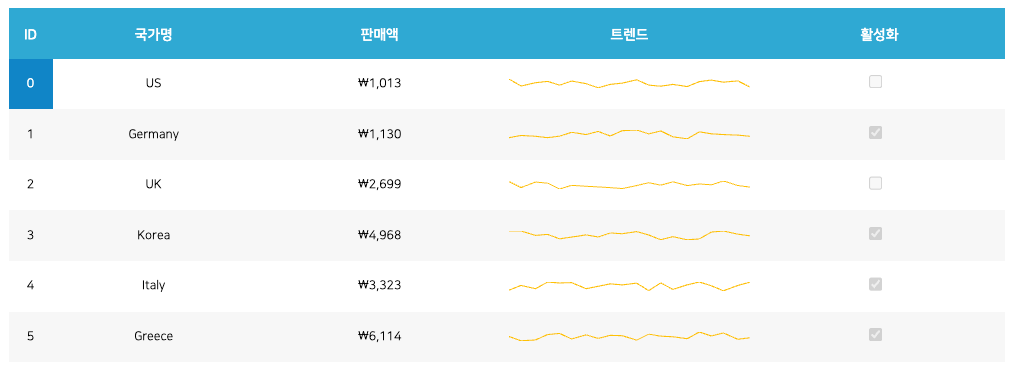
-
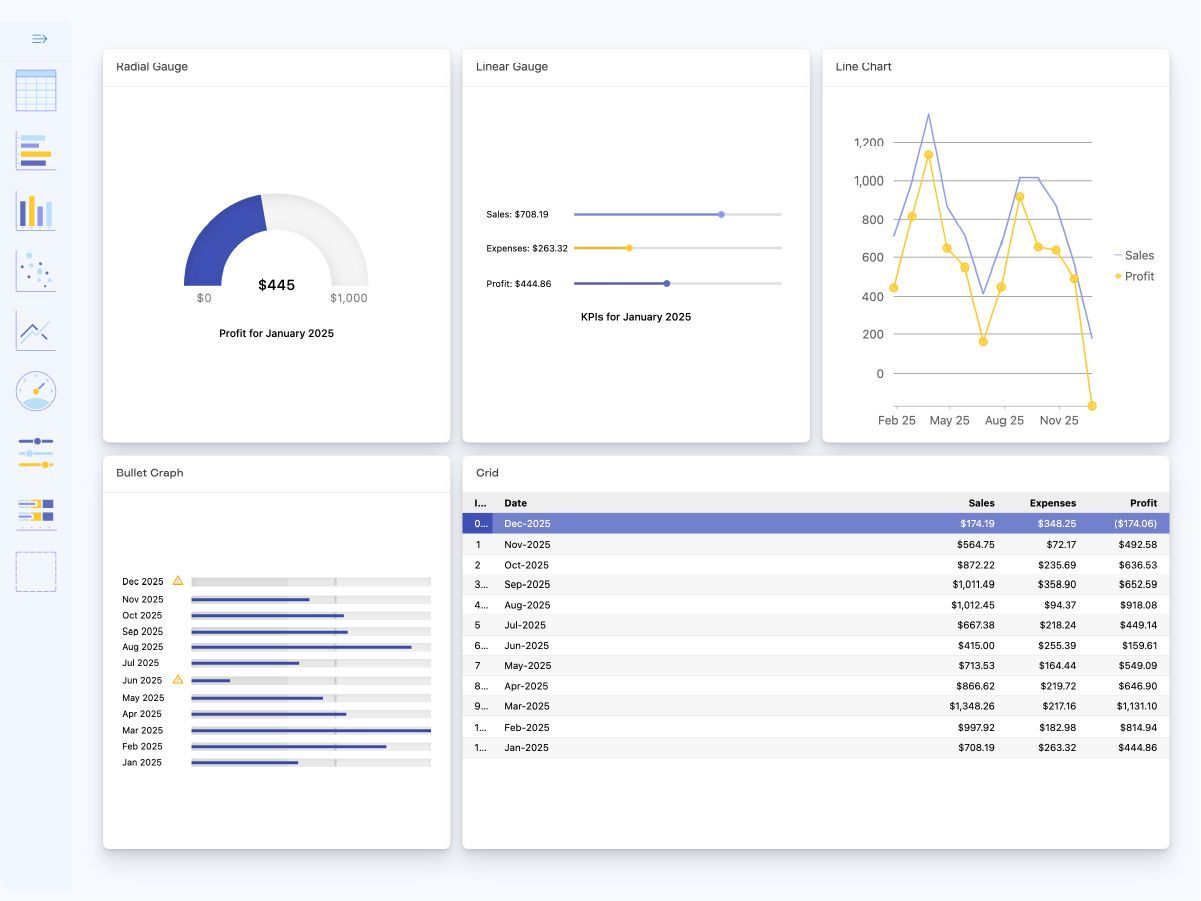
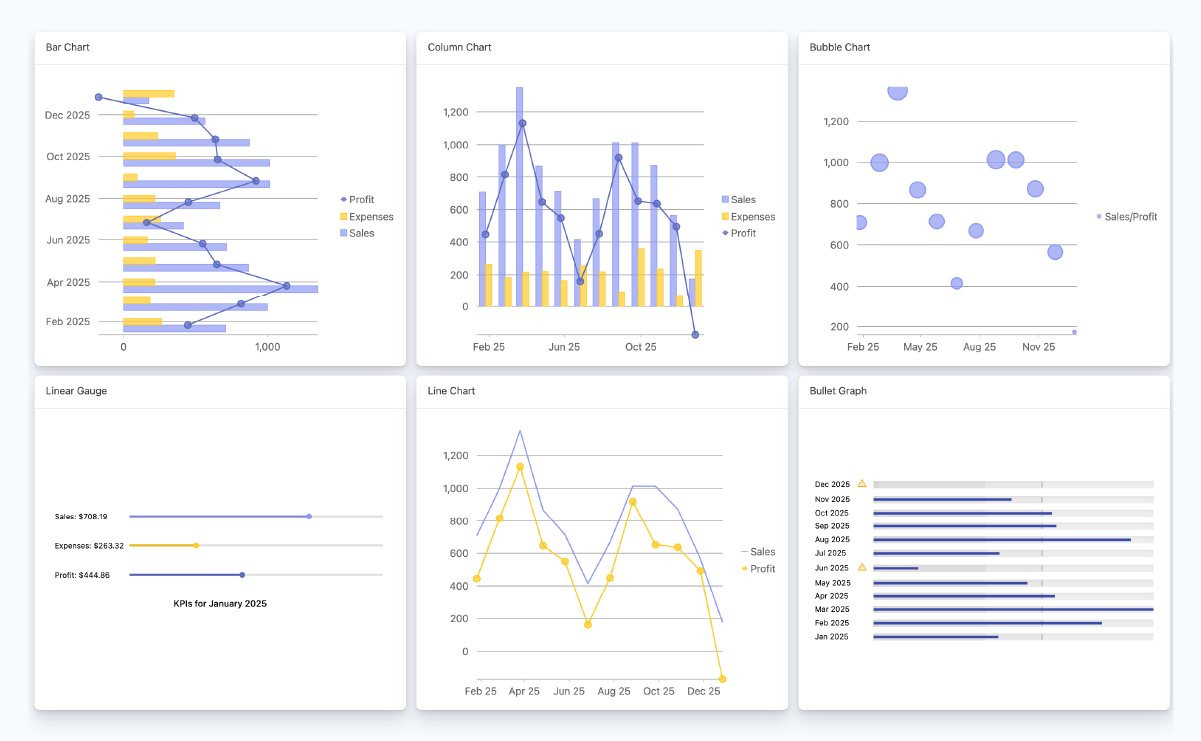
Below is the code to add the FlexChart module.
import * as wjChart from '@mescius/wijmo.react.chart';<Preview>
Click the button below to view the full code sample.
Run Online Sample 🖥️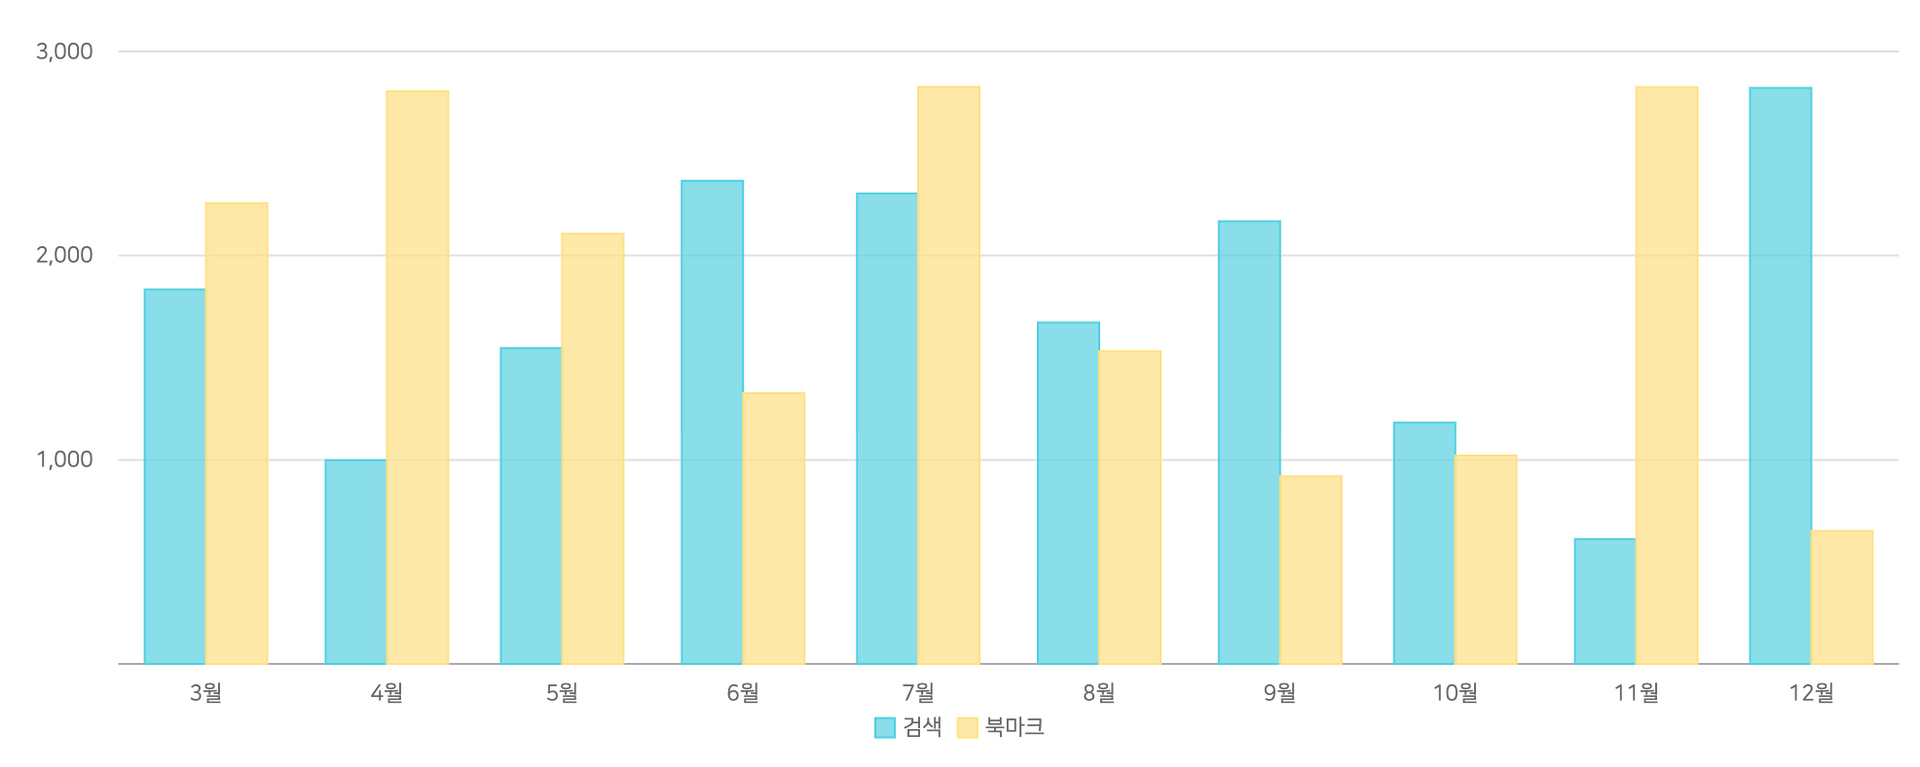
-
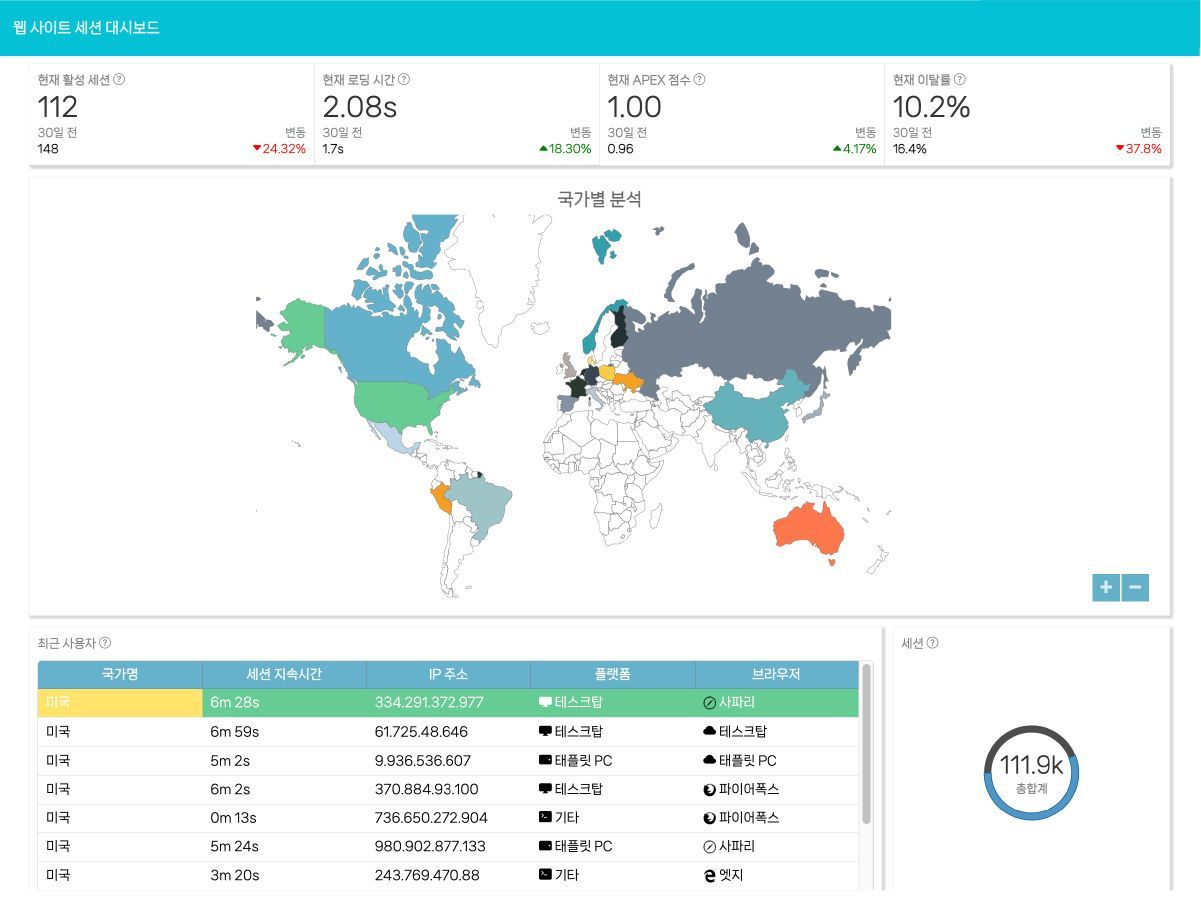
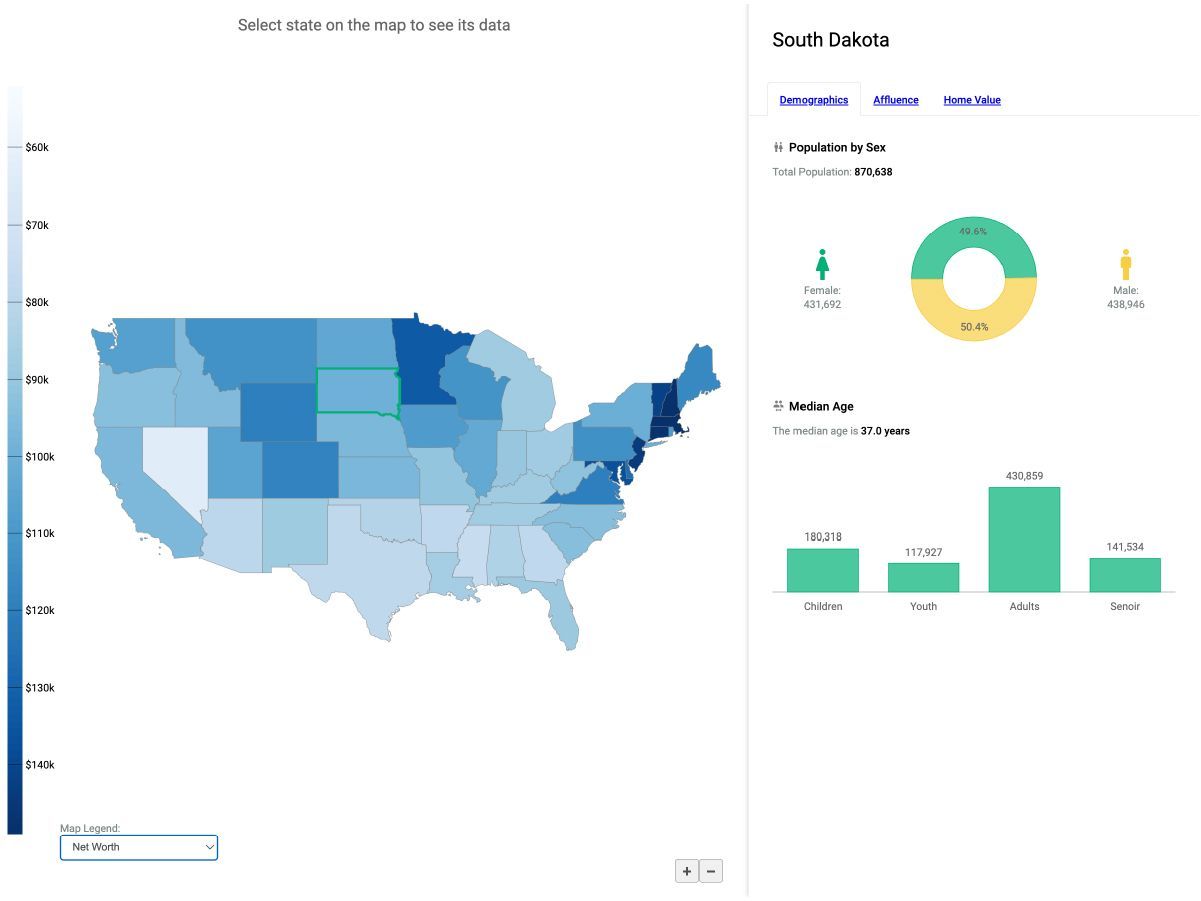
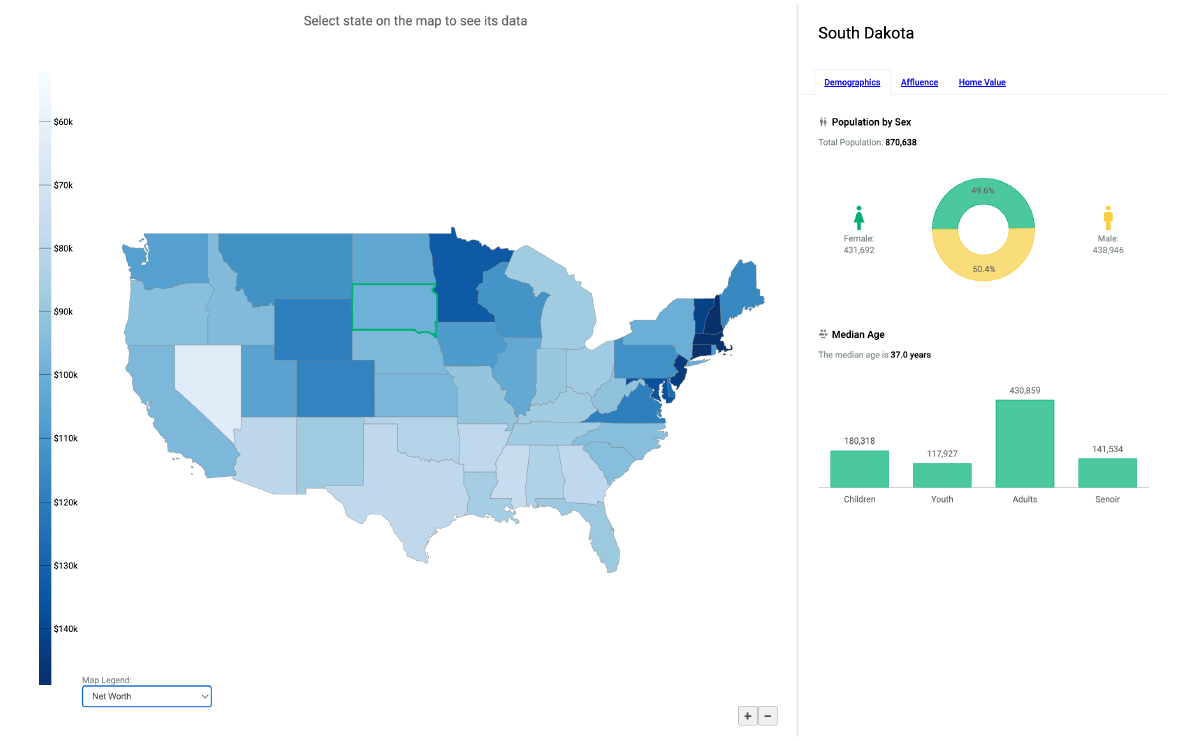
Below is the code to add the FlexMap module.
import * as wjcMap from '@mescius/wijmo.react.chart.map';<Preview>
Click the button below to view the full code sample.
Run Online Sample 🖥️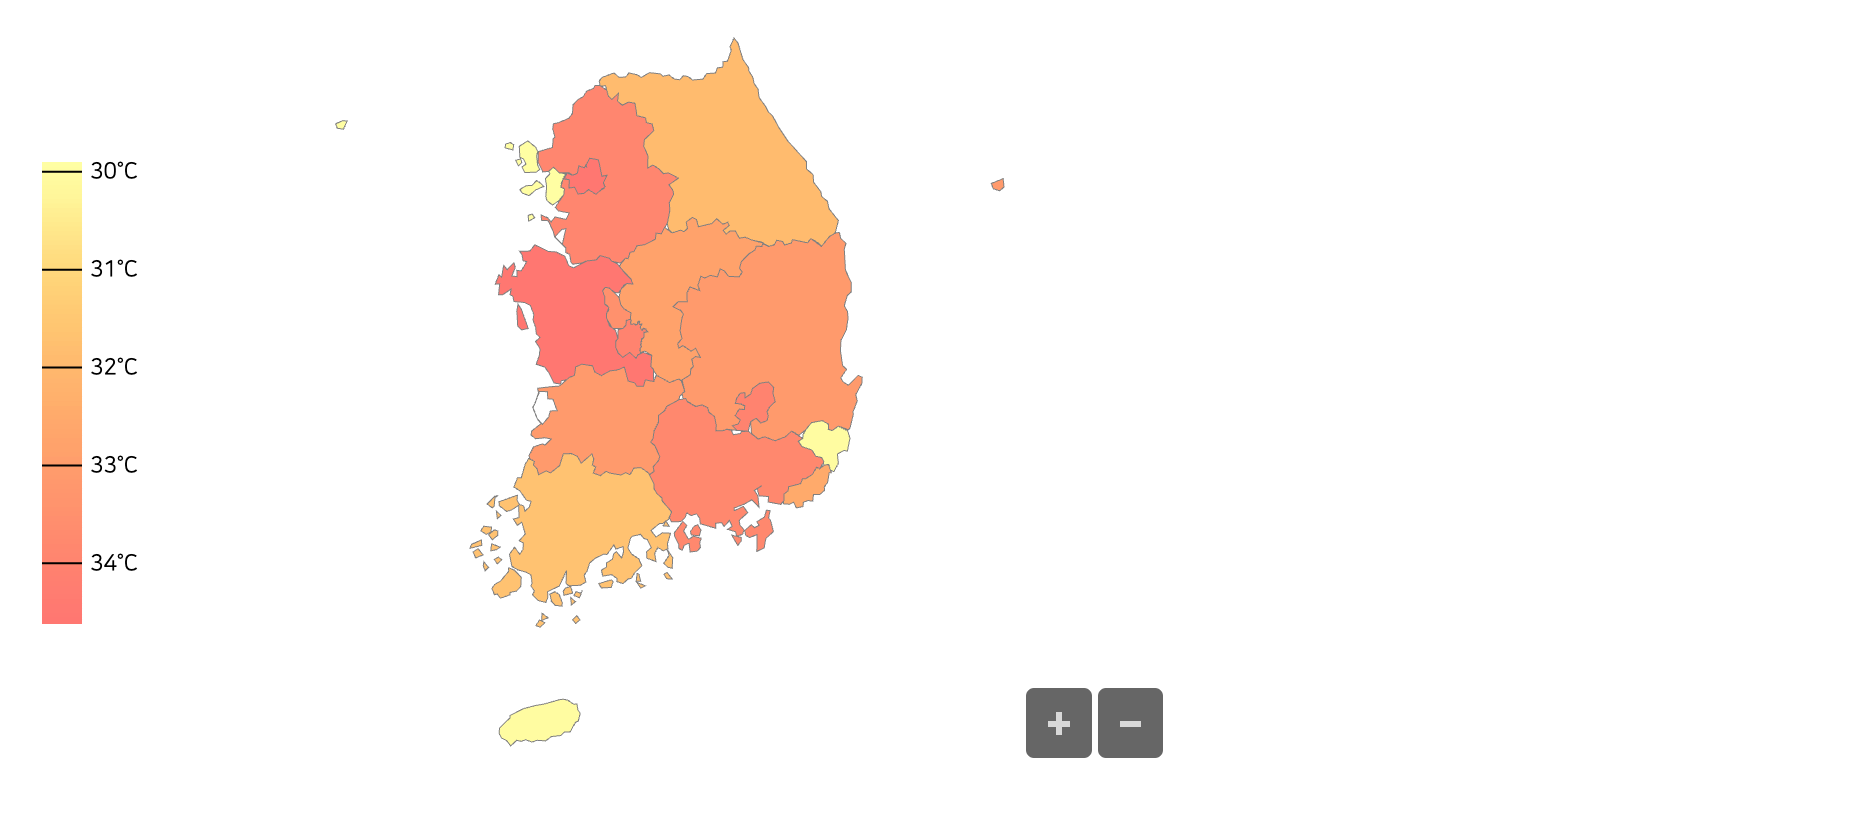
-
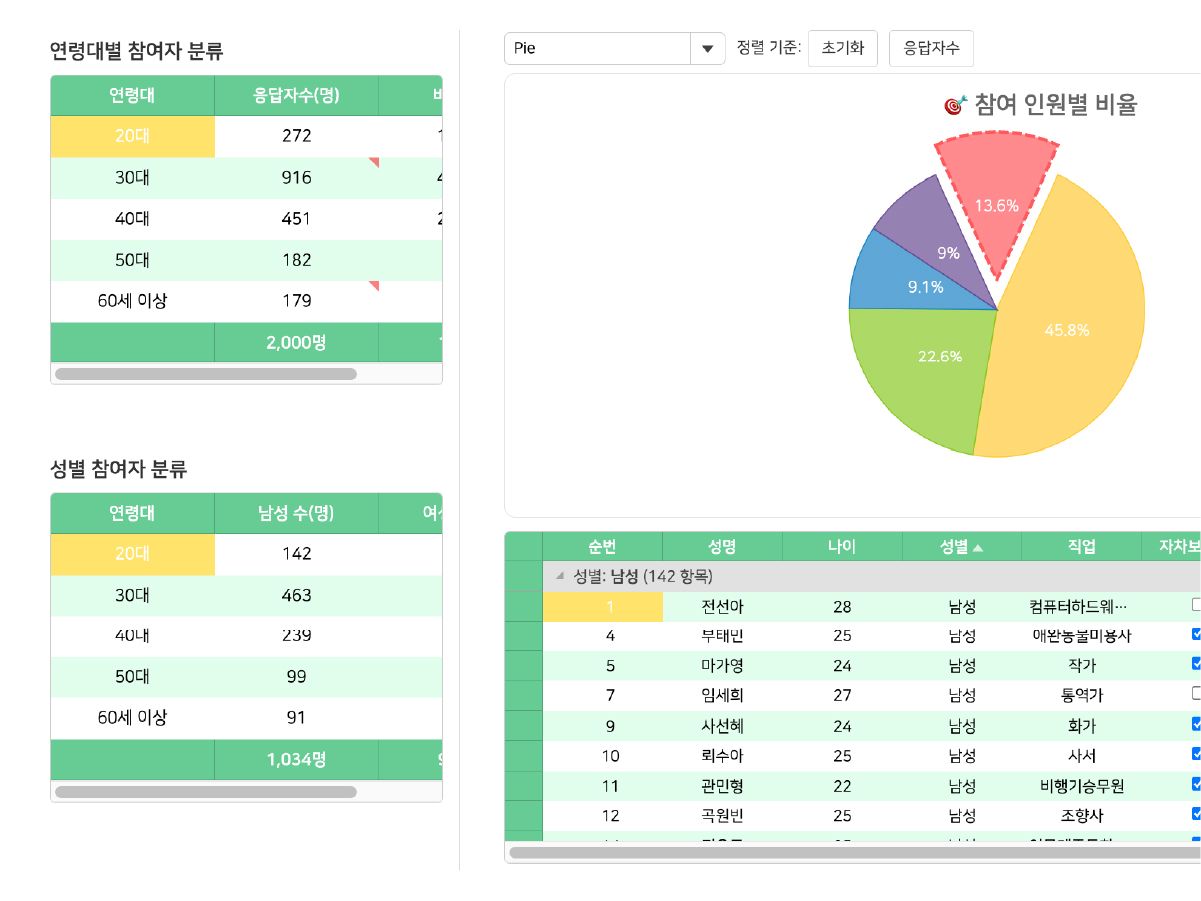
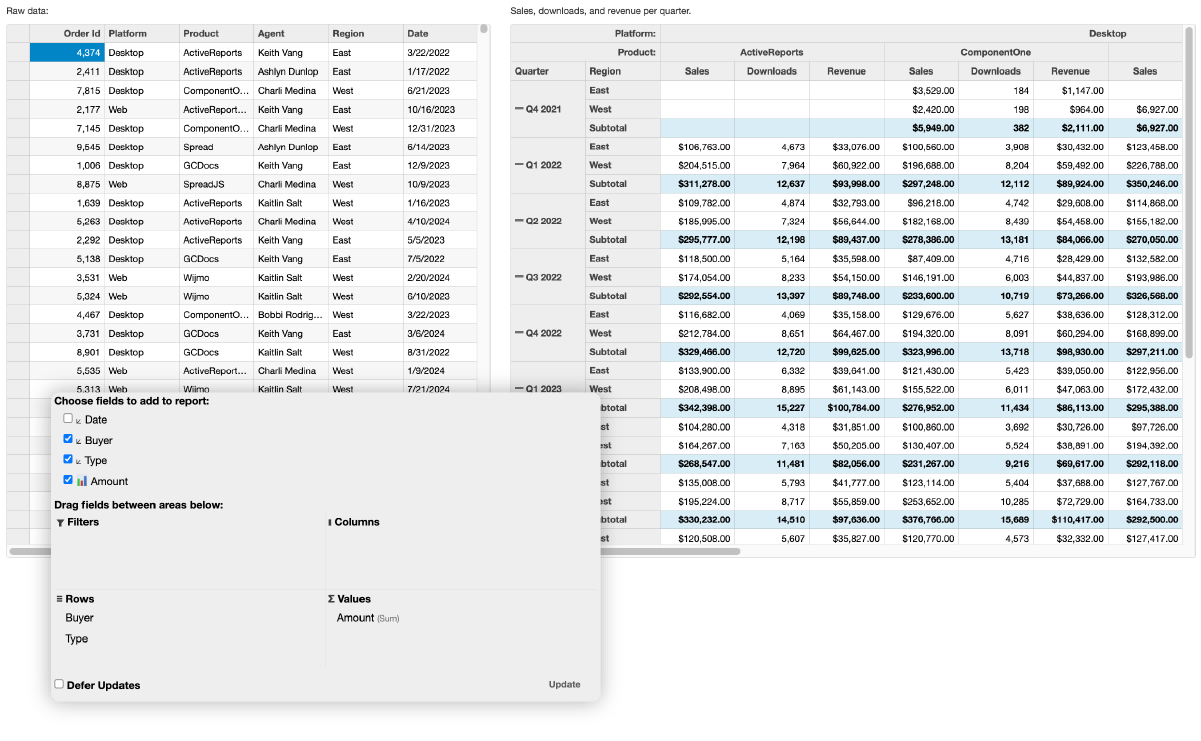
Below is the code to add the OLAP module.
import * as Olap from '@mescius/wijmo.react.olap';<Preview>
Click the button below to view the full code sample.
Run Online Sample 🖥️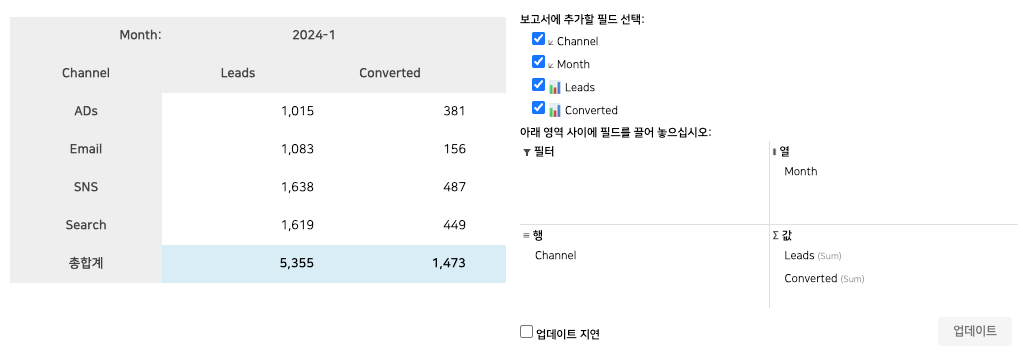
-
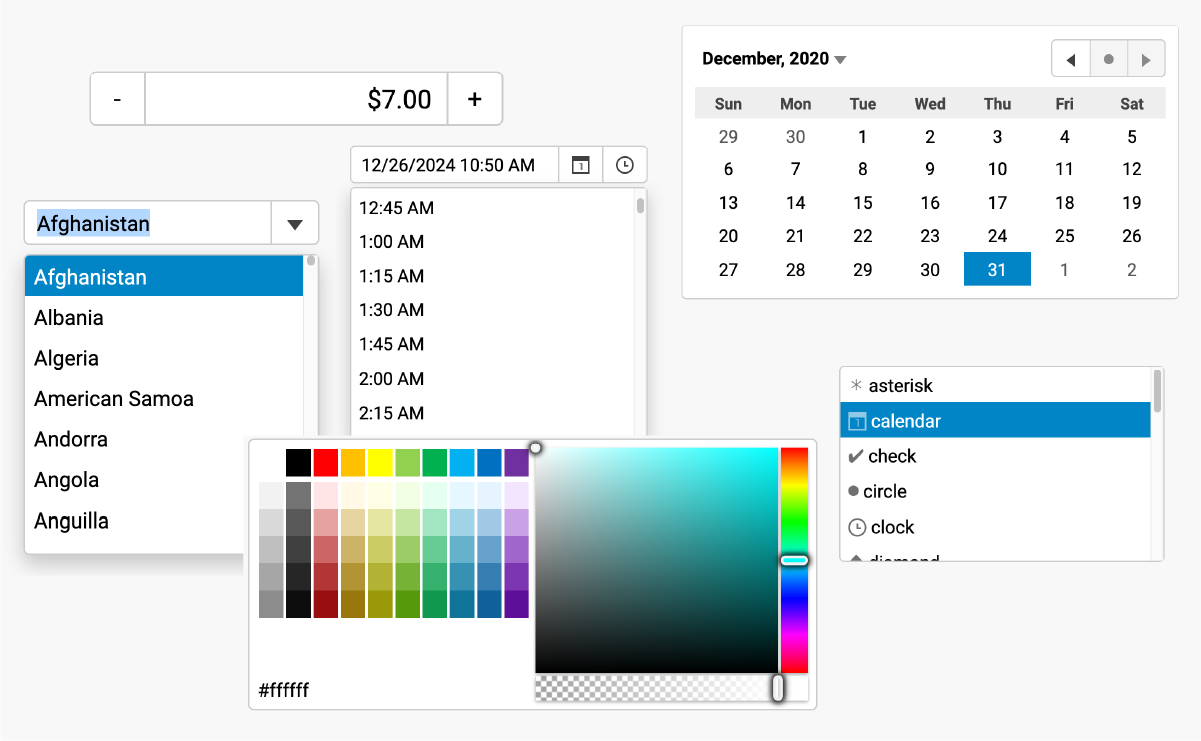
Below is the code to add the Input module.
import * as wjInput from '@mescius/wijmo.react.input';<Preview>
Click the button below to view the full code sample.
Run Online Sample 🖥️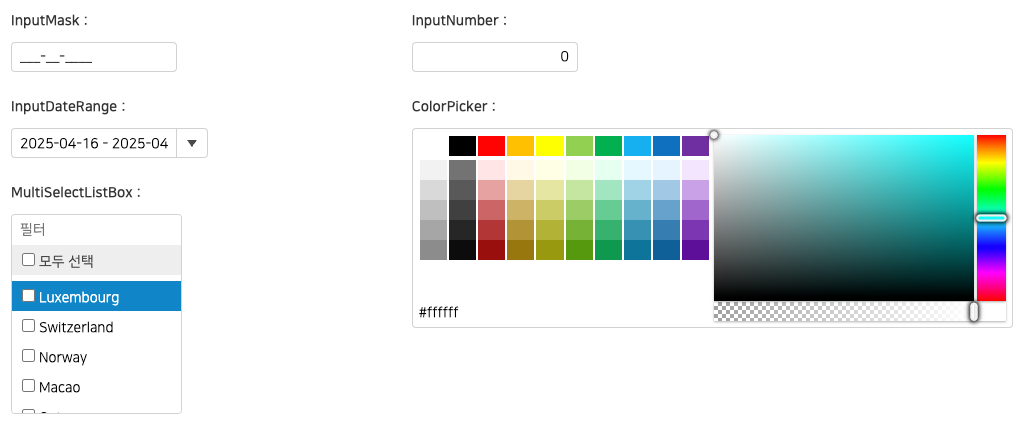
7. Run the Next.js app to see the results.
npm run dev
Next.js & React Starter Template
Jump-Start Your Development with Customizable Next.js & React Samples and Templates.
Explore a variety of templates and samples built with Wijmo. View live demos and download the source code to customize for your own projects.
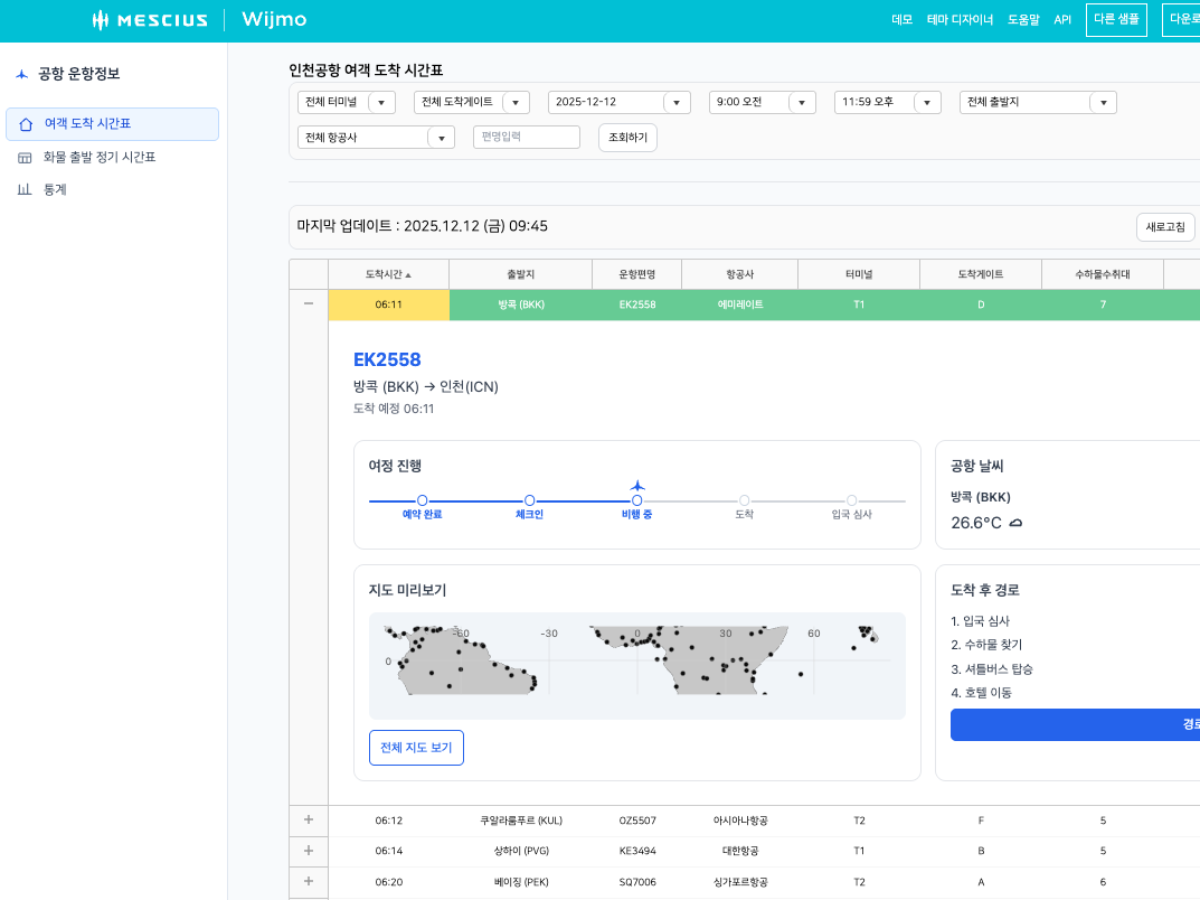
Flight Operations Dashboard
A dashboard sample that utilizes Wijmo’s FlexGrid, PivotGrid, and Map controls to provide a comprehensive view of arrival and departure information. With powerful pivot features, users can analyze flight operations from various perspectives and gain actionable insights at a glance.
Download ZIP File
TutorialView Demo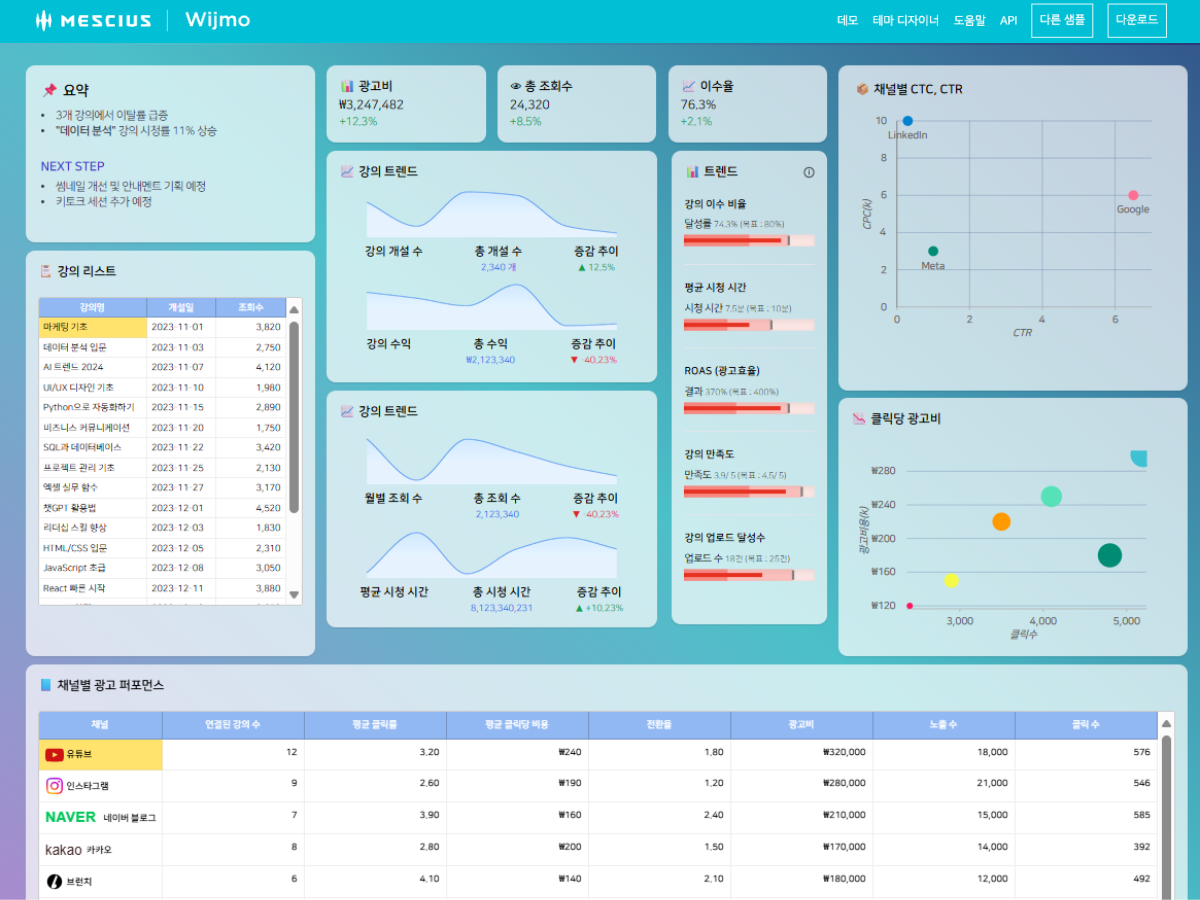

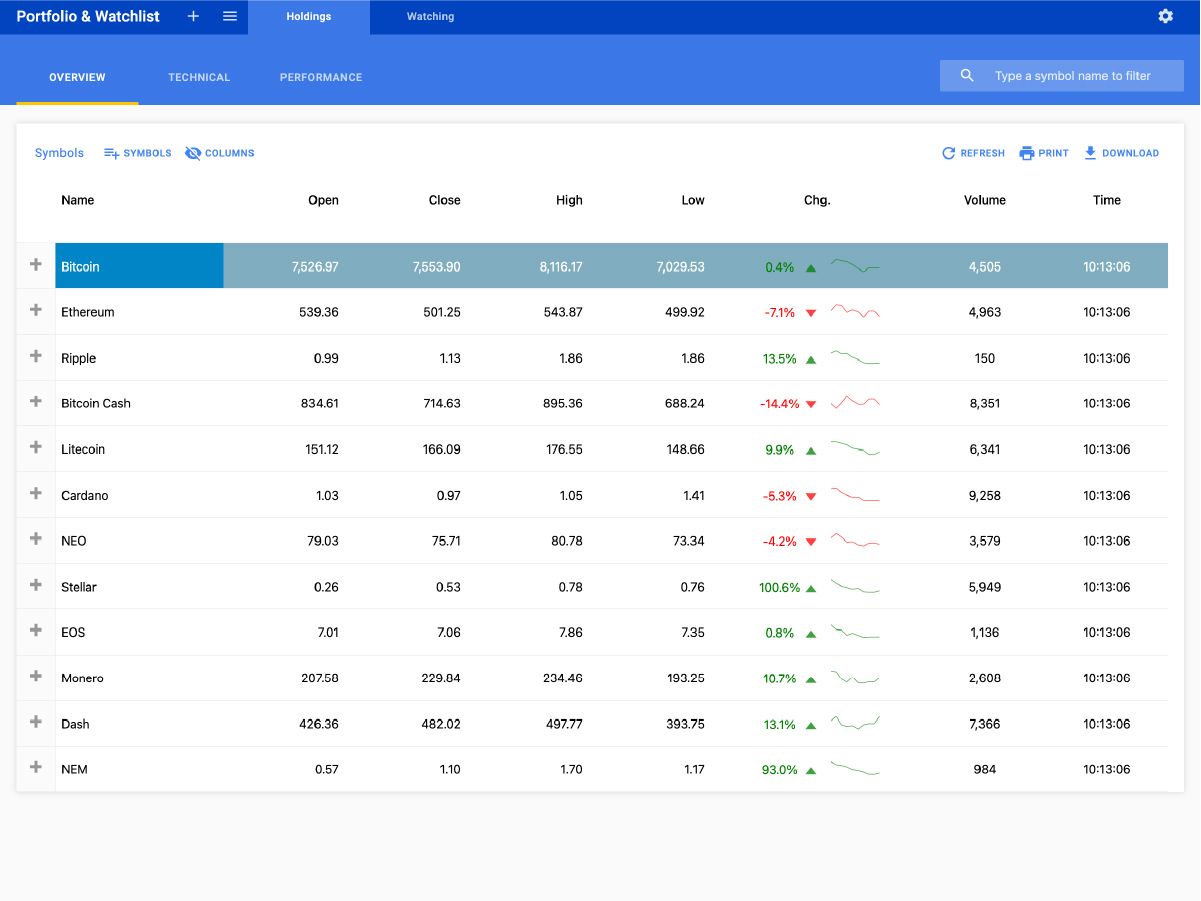
Cryptocurrency Tracking
Track cryptocurrency values by integrating Wijmo's powerful financial charting component into your grid.
Download Zip File
View Demo
Next.js & React UI Control Designer
Easily Customize Wijmo Controls!

Easily create design themes using the Wijmo CSS Theme Designer and apply the created CSS to your Wijmo controls!

Easily customize the settings of Wijmo controls using the Wijmo Control Properties Editor. You can modify and check the settings for over 20 different controls. Download these settings and quickly and easily apply them to your web without any additional coding.

Ask Anything!
Share your vague concerns and questions about Spread.NET with MESCIUS's expert team. We empathize with your concerns and are here to help.
Next.js & React UI Control Online Study
Discover the Many Ways to Use Wijmo Next & React UI Controls.
-
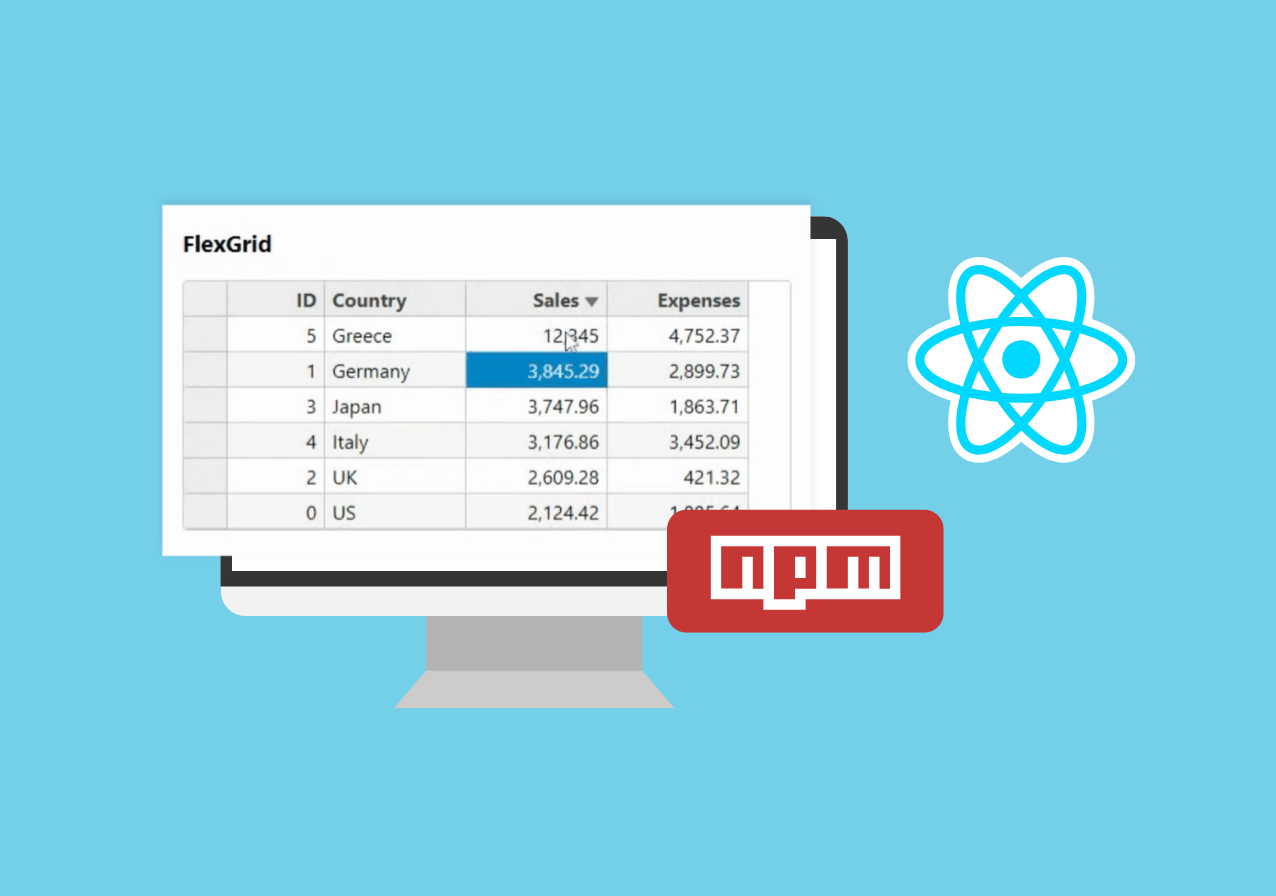
How to Create a Grid Based on React Functional Components (Feat. NPM)
This article explains step-by-step why you should use functional components and how to create a grid based on React functional components using Wijmo.
-
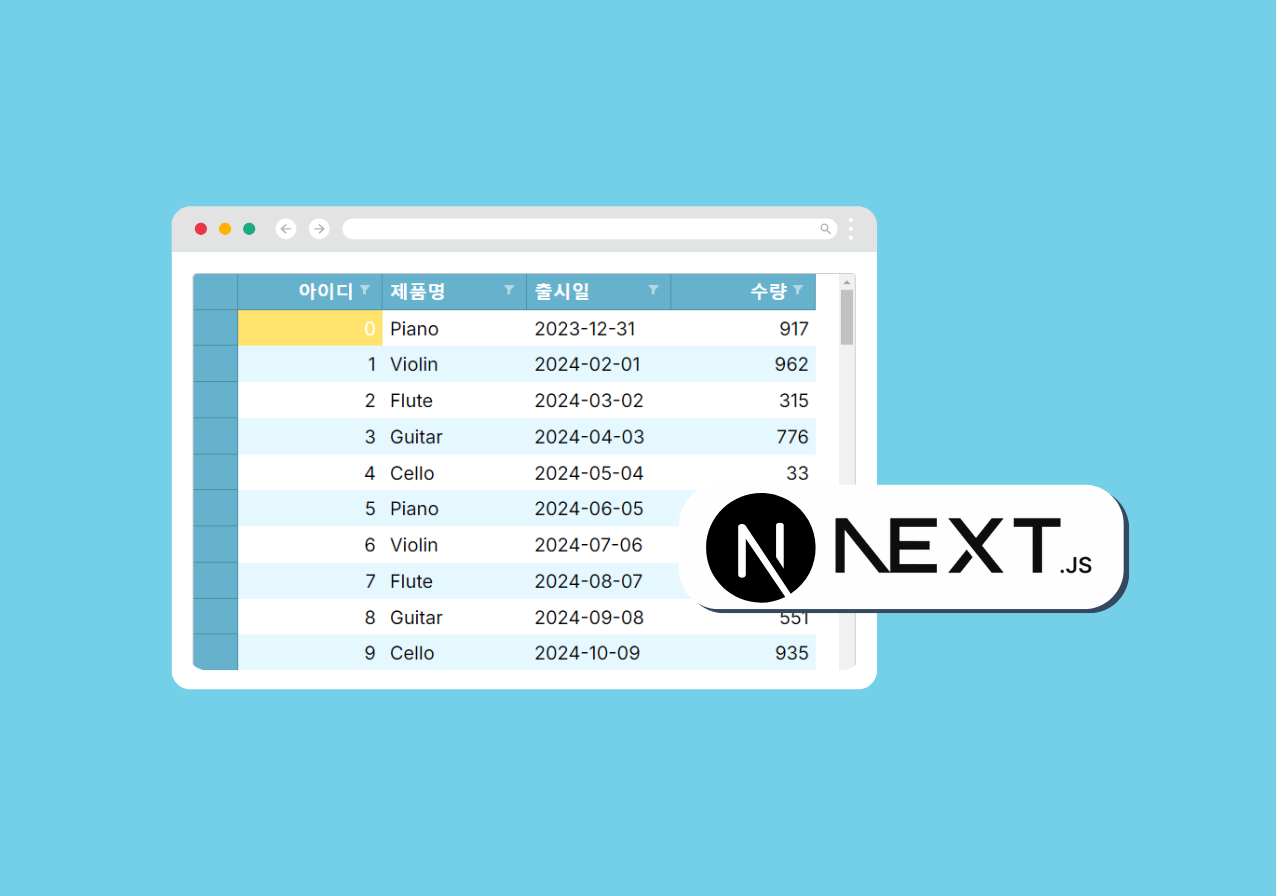
Using Wijmo DataGrid in Next.js
This article explains how to create a Wijmo data grid in Next.js, which is easy to use and scalable.
-
How to fetch data with Axios and create a React grid
We'll cover how to use Axios to fetch data and Wijmo's data grid to visualize that data.