JavaScript UI Components Online Tutorial
Wijmo Tutorials & Templates
Explore Wijmo's diverse features and learn how to implement them right now.
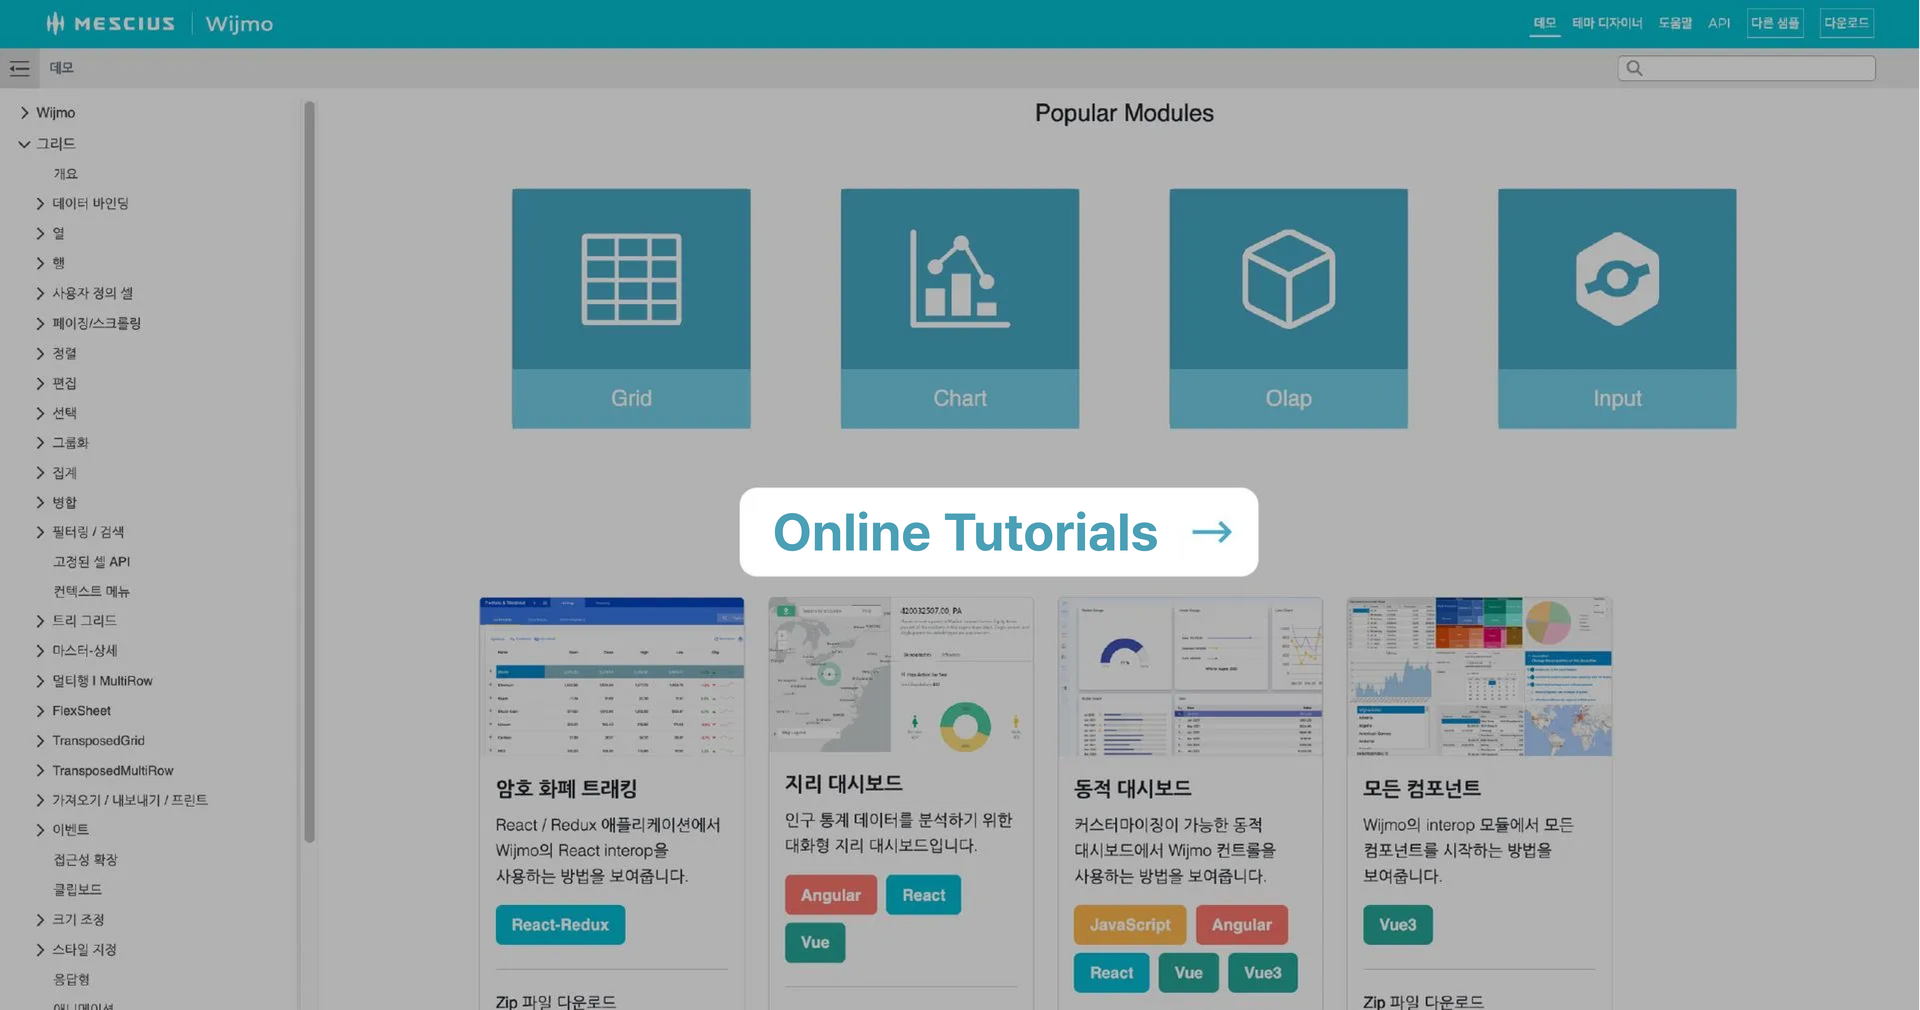
Wijmo Online Tutorial
Learn the Various Features of JavaScript UI Controls, such as Grids and Charts, Through Demos and Tutorials. 📚
Get Started Quickly with Wijmo
Getting Started Guides for Each JavaScript Framework 📖
Learn how to get started with Wijmo in different frameworks.


Ask Anything!
Share your vague concerns and questions about Spread.NET with MESCIUS's expert team. We empathize with your concerns and are here to help.
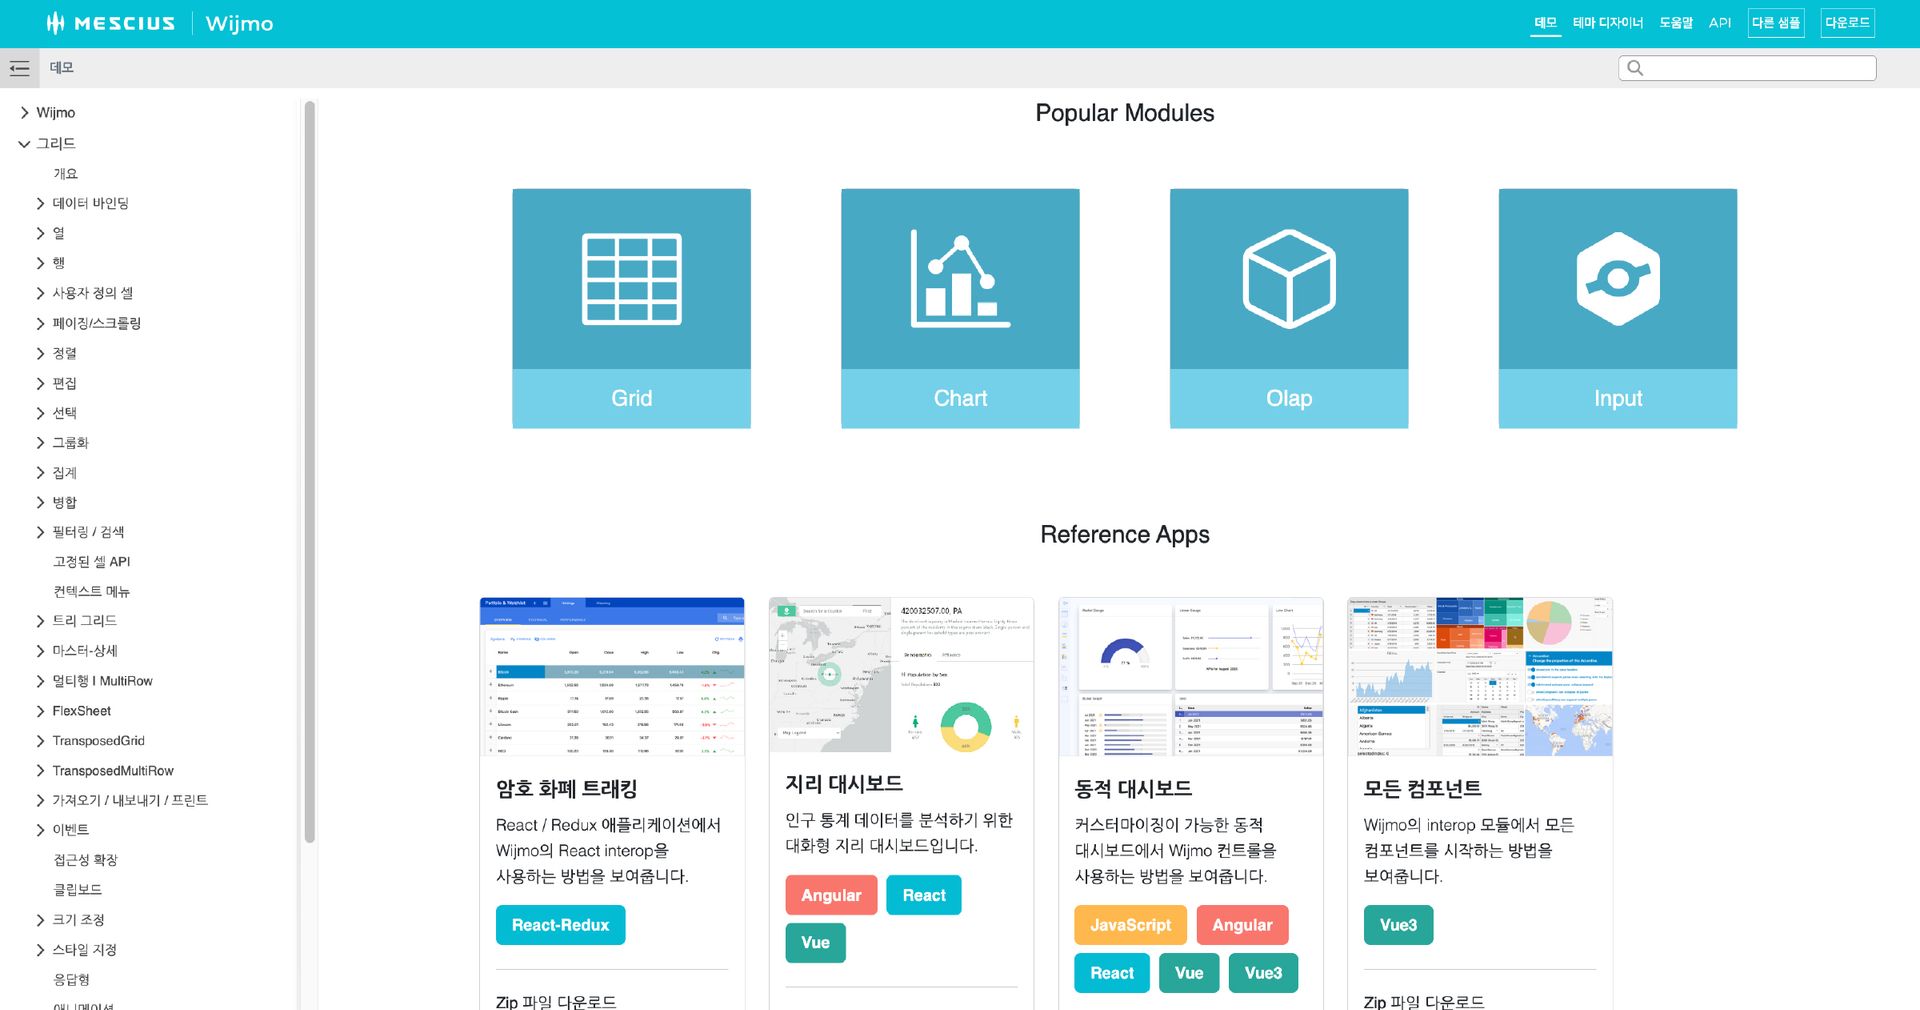
Wijmo Templates & Samples
Jump-Start Your Development with Customizable Samples and Templates.
Here are various templates and samples utilizing Wijmo. You can check out the actual demos and download the source code to customize and use them yourself.
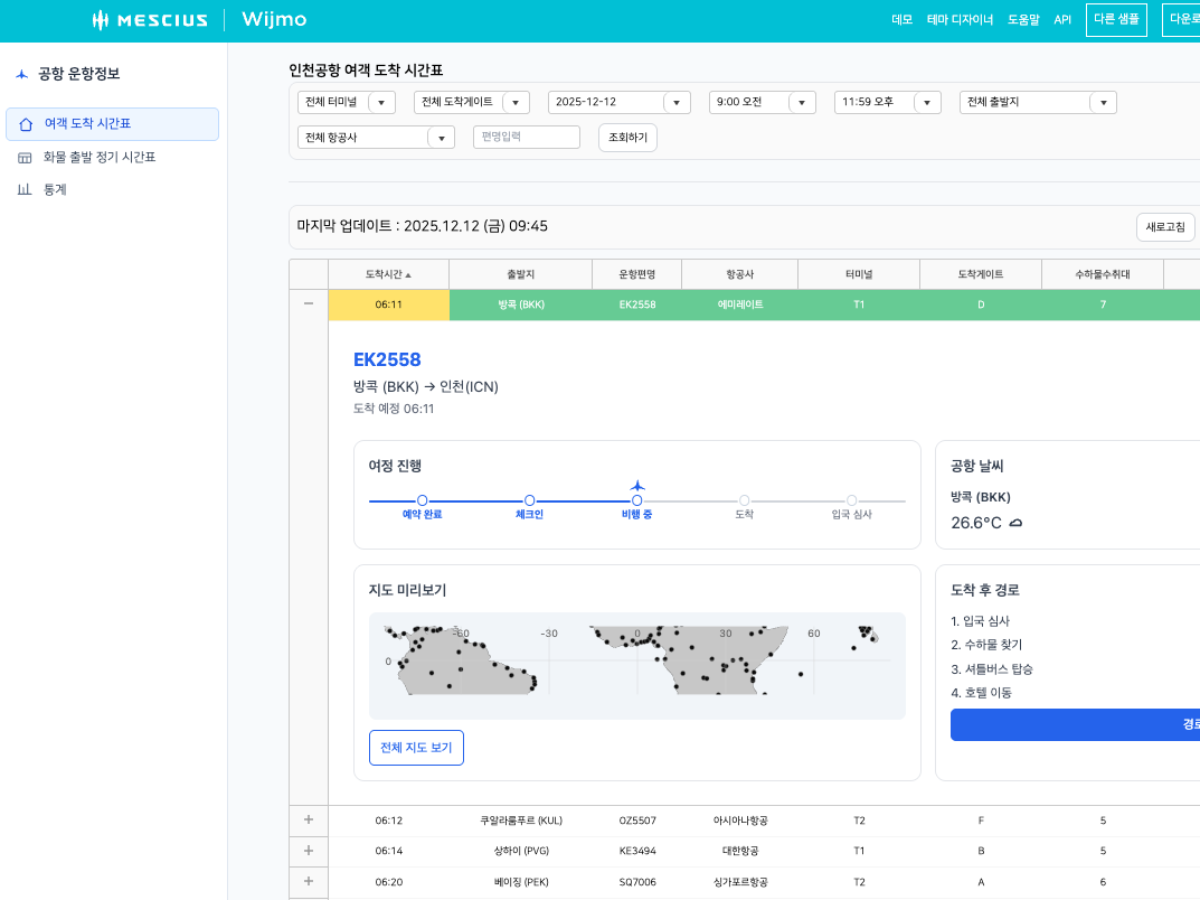
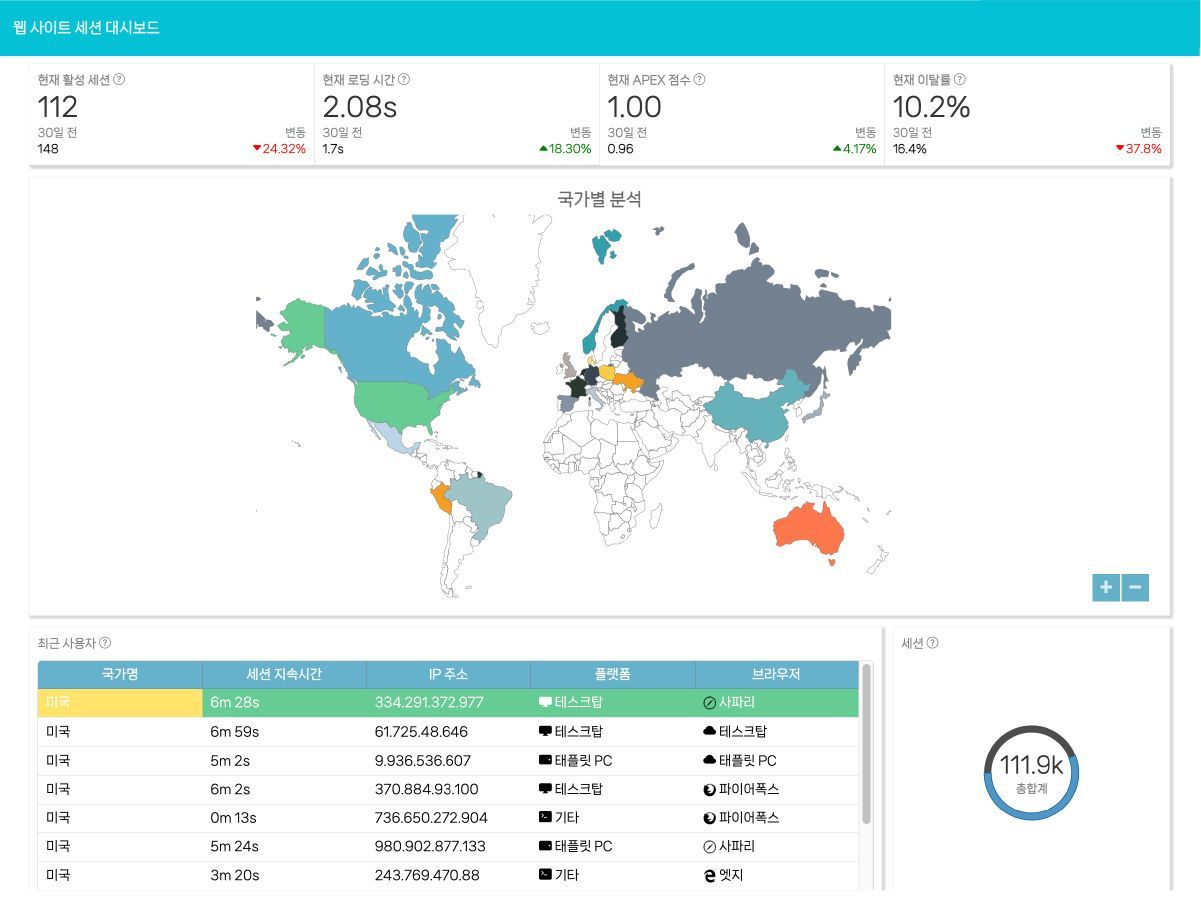
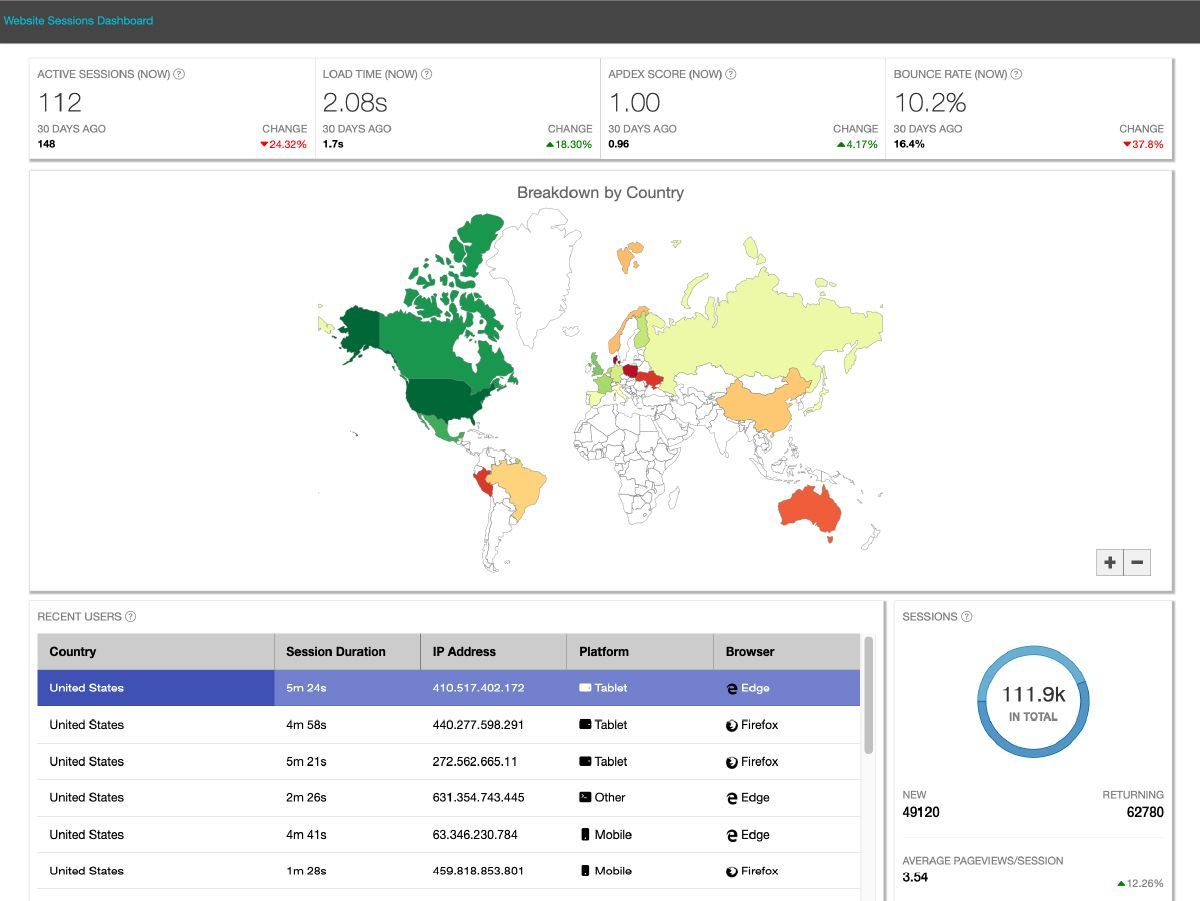
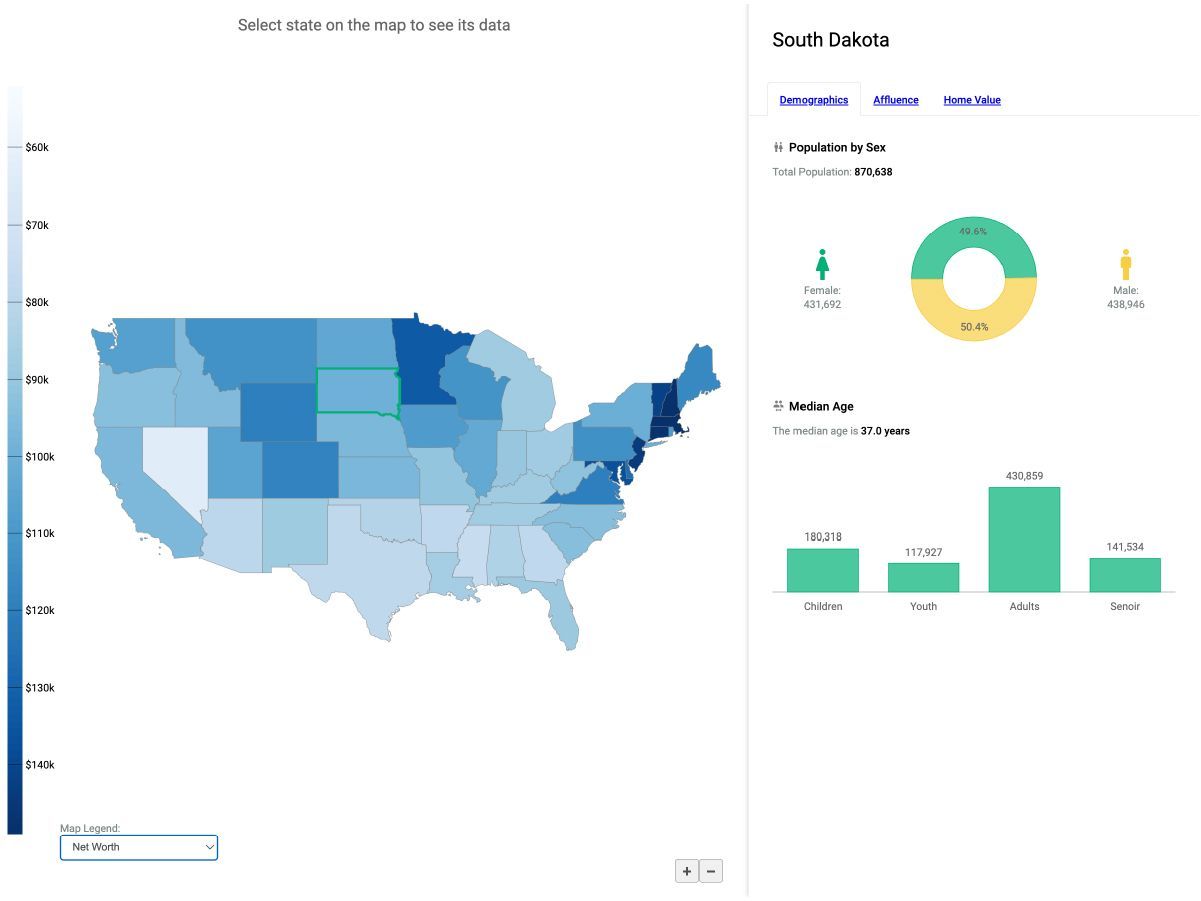
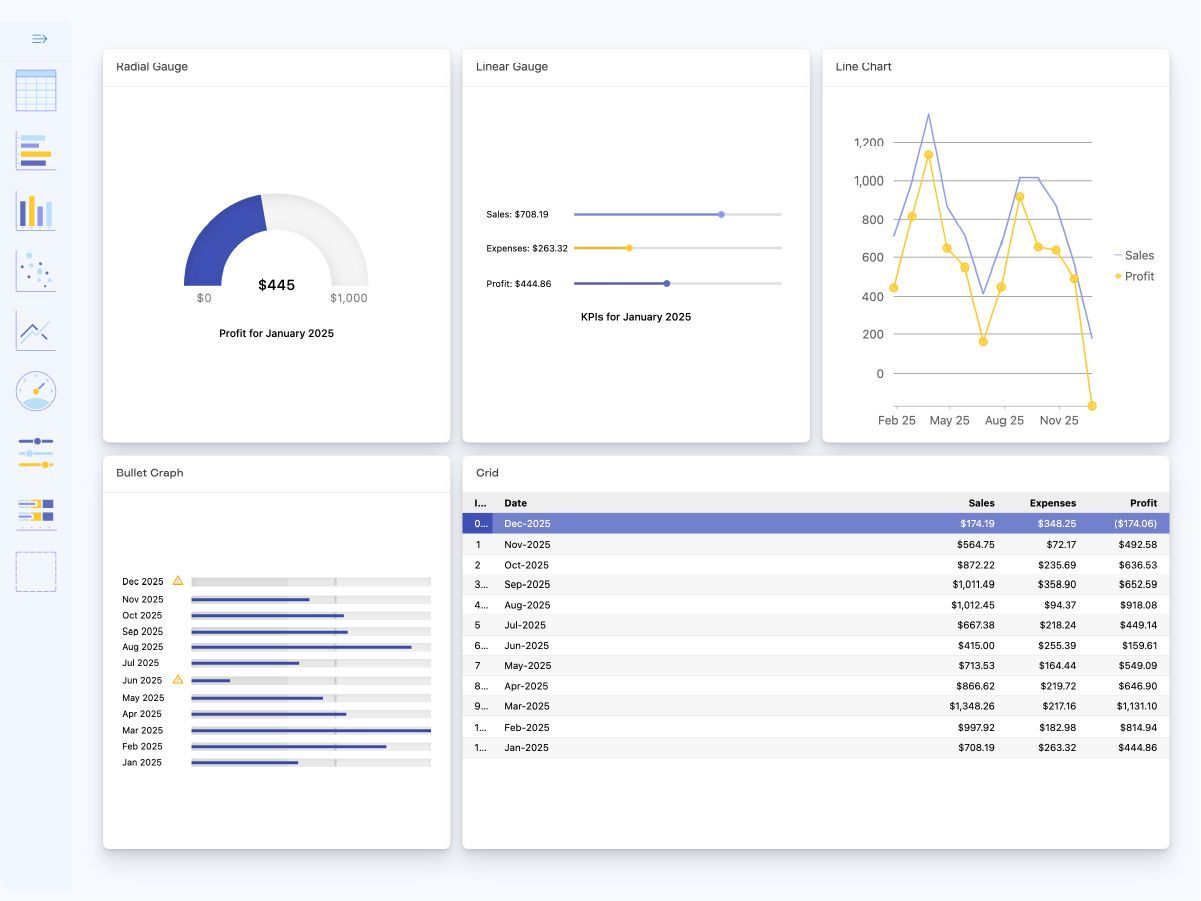
Flight Operations Dashboard
A dashboard sample that utilizes Wijmo’s FlexGrid, PivotGrid, and Map controls to provide a comprehensive view of arrival and departure information. With powerful pivot features, users can analyze flight operations from various perspectives and gain actionable insights at a glance.
Download ZIP File
TutorialView Demo

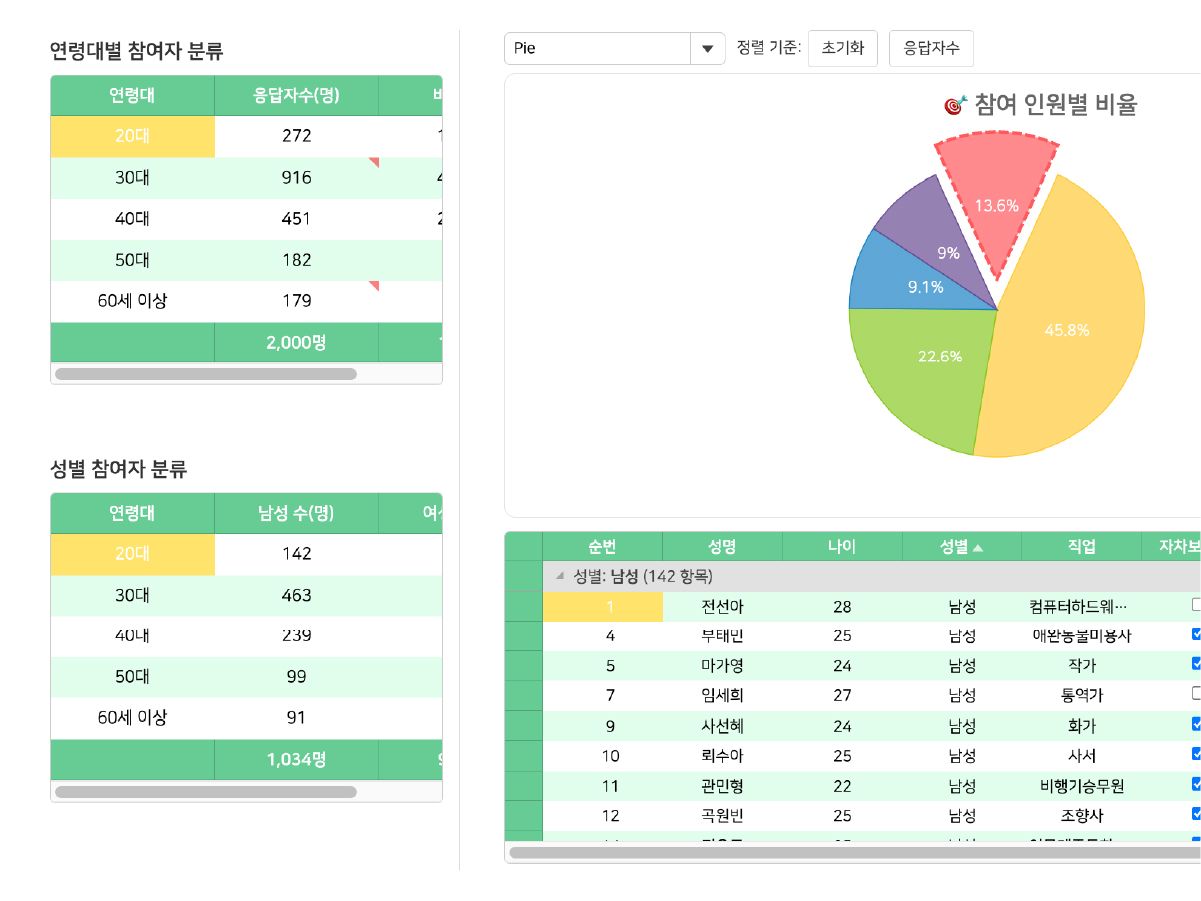
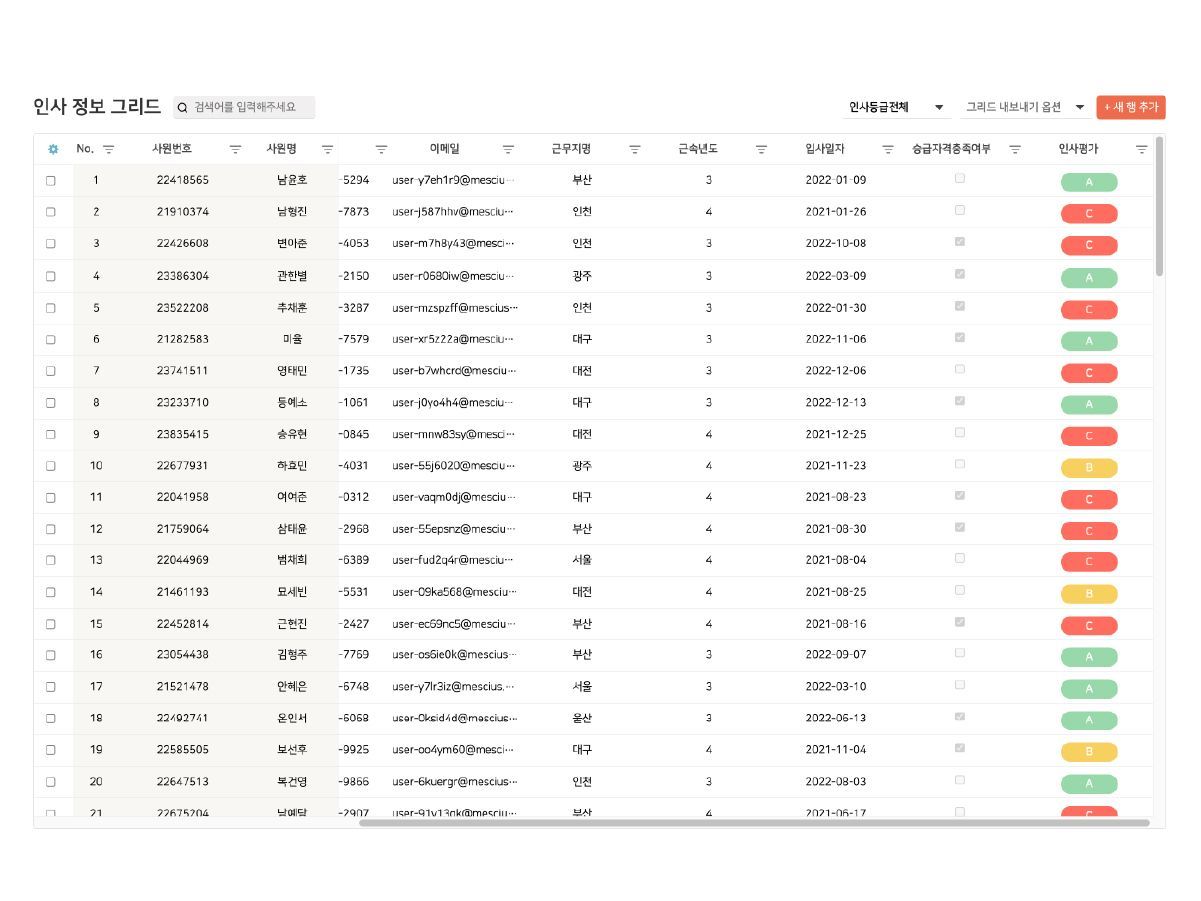
Personnel Information Inquiry Data Grid
Based on Wijmo FlexGrid, it's designed to provide a comprehensive overview of various personnel data, including job titles, departments, and employee numbers, and offers a convenient user experience with filtering, search, and export features.
Download Zip File
View Demo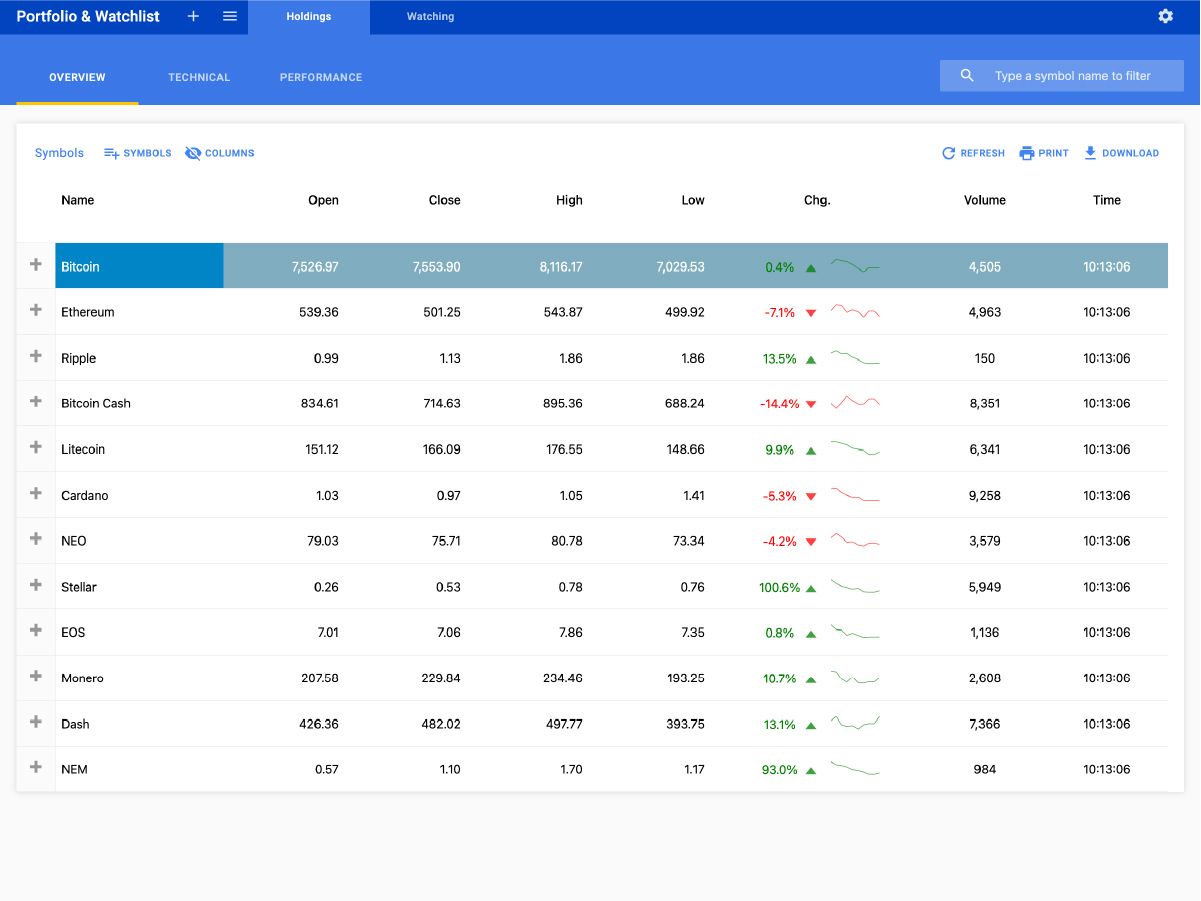
Cryptocurrency Tracking
Track cryptocurrency values by integrating Wijmo's powerful financial charting component into your grid.
Download Zip File
View Demo