Enhanced JavaScript Visualization Components for Financial Applications
Quickly visualize stock trends with powerful financial charting components.
- Includes 9 professional financial charts
- Built-in calculation engine
- Full support for Angular, React, and Vue.js

Ask Anything!
Share your vague concerns and questions about Spread.NET with MESCIUS's expert team. We empathize with your concerns and are here to help.
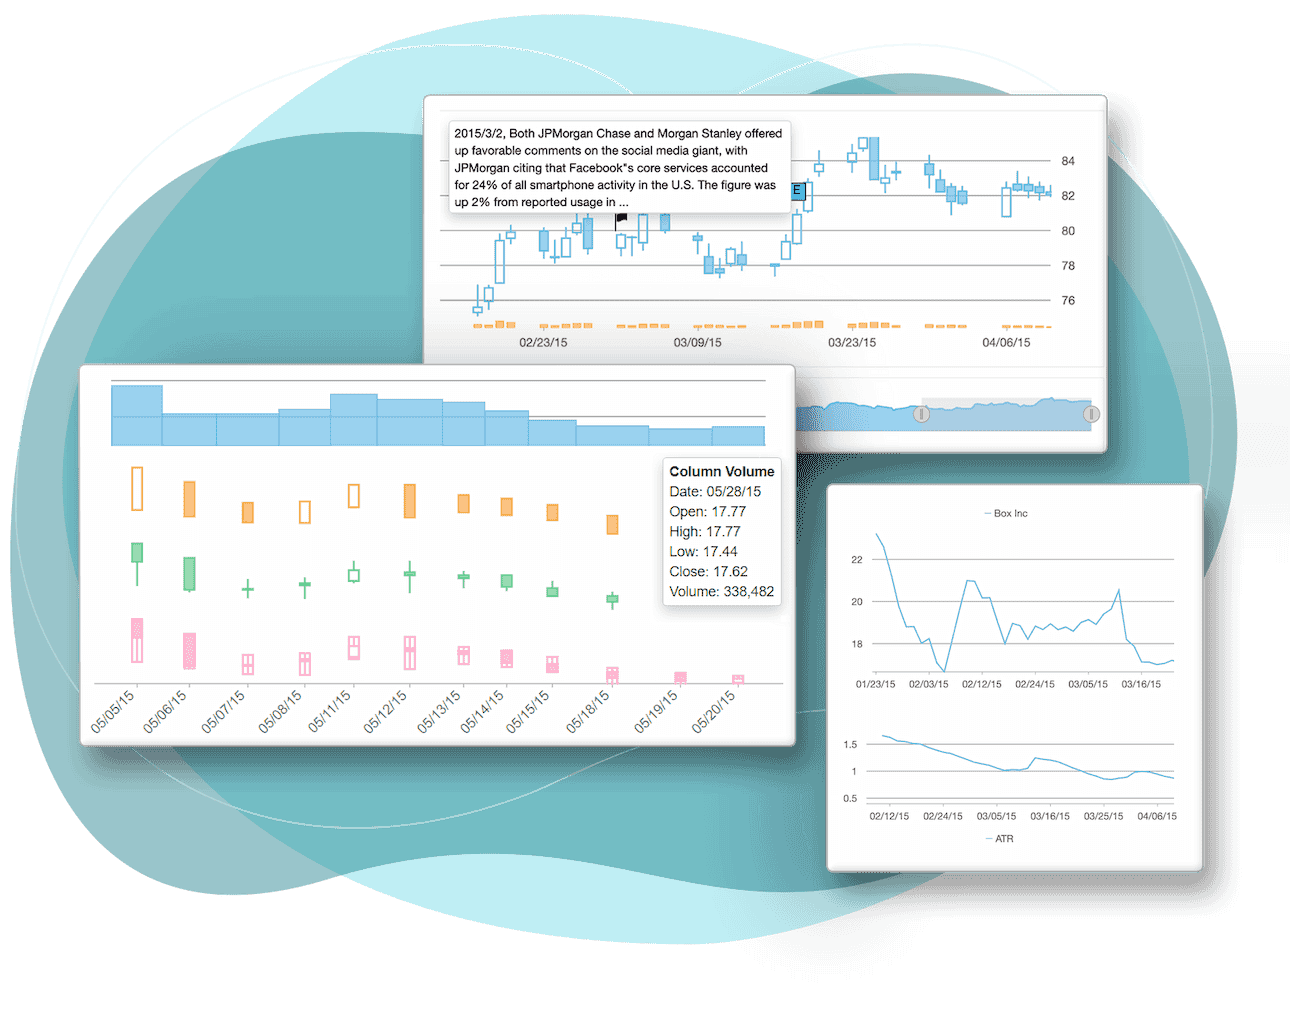
JavaScript Financial Chart Types
-
Cylinder ChartList Item 1Shows a cylinder chart type with tooltips. A cylinder chart is used to illustrate price fluctuations of securities, derivatives, or currencies over time.
-
Heikin-AshiList Item 2The standard k-line graph and Heikin-Ash graph are identical, filtering out some unnecessary information. They visualize changes in the average stock price using a specific formula.
-
RenkoList Item 3Renko charts completely ignore the time element and focus solely on price movements. By filtering out unnecessary information often seen in k-line graphs, users can easily observe market trends. Another unique feature of Renko charts is that each brick is of the same size (height).
-
KagiList Item 4Kagi charts appear similar to step charts, but they completely ignore the time element and focus solely on pre-determined market reversal amounts. A change in the thickness (or color) of the Kagi line indicates a market reversal.
-
Line Conversion ChartA line chart is similar to a point/figure chart. It ignores the time factor and changes direction only when the price reaches a certain value. A reversal occurs before the closing price exceeds the high or falls below the low.
-
Volume ChartThe sample displays ColumnVolume, CandleVolume, and EquiVolume charts as three stacked plot areas to show the differences between each area.
-
HighLowOpenClose ChartHighLowOpenClose charts are used to illustrate price movements of securities, derivatives, or currencies over time. Similar to a candlestick chart, the opening price is indicated by a line on the left, and the closing price is indicated by a line on the right.
JavaScript Chart Functions
-
Line MarkerList Item 1Display crosshairs and text on specific data elements
-
Range SelectorList Item 2End users can adjust the date range
-
Trend LineList Item 3Display trends over time using options like linear, exponential, and polynomial.
-
Moving AverageList Item 4Generate a set of averages from the original data set
-
Event AnnotationMark important events in specific data elements
-
Financial IndicatorsAll indicators (Stochastic, MACD, Williams %R, Relative Strength Index, Average Amplitude, Commodity Channel Index) included in the dropdown
-
Financial OverlayBollinger Bands and Envelopes
-
Fibonacci ToolFibonacci tools (arc, sector, tracing, timeframe) for trend analysis
Ask Anything!
Share your vague concerns and questions about Spread.NET with MESCIUS's expert team. We empathize with your concerns and are here to help.
Wijmo Tutorial
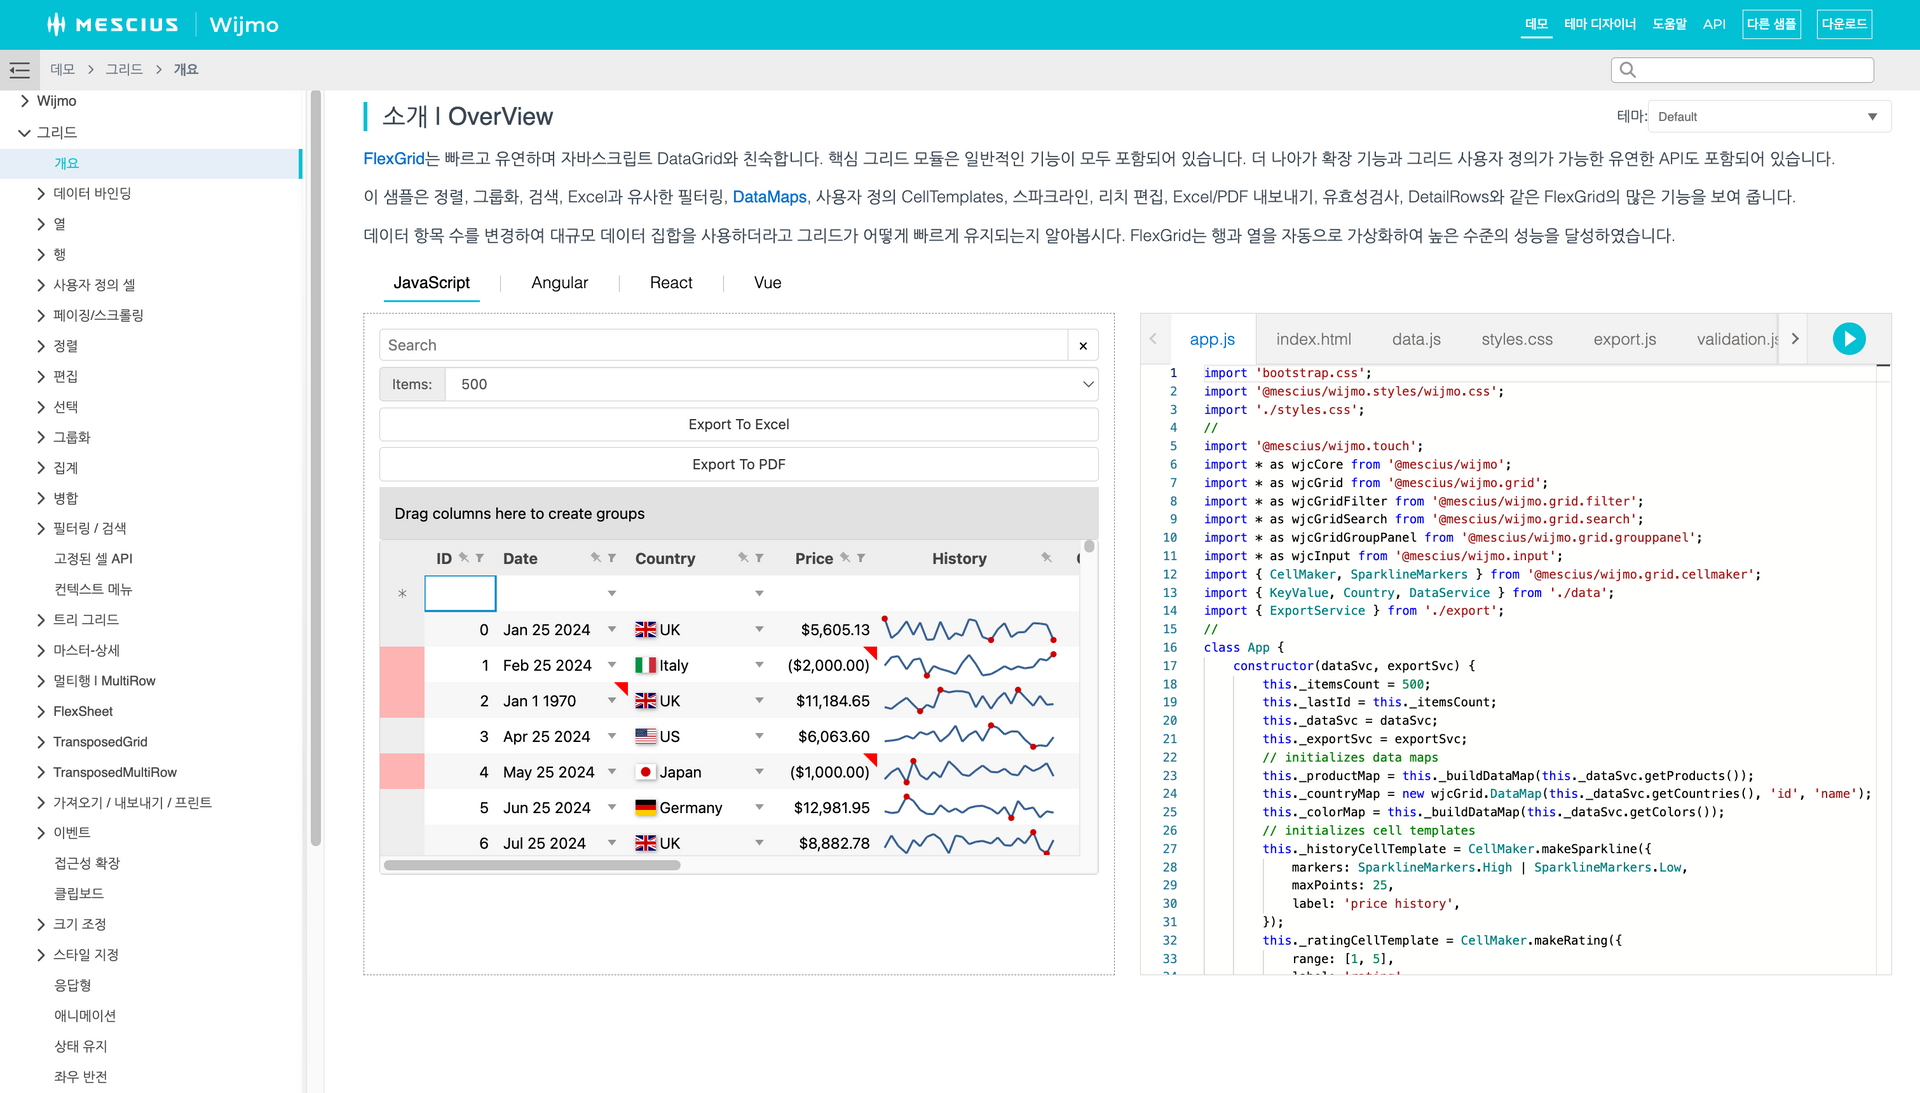
You can check out the demo and learn how to implement it in practice through the tutorial.
Provides code for Angular, React, and Vue frameworks.


Easily Customize Wijmo Controls!

Easily create design themes using the Wijmo CSS Theme Designer and apply the created CSS to your Wijmo controls!

Easily customize the settings of Wijmo controls using the Wijmo Control Properties Editor. You can modify and check the settings for over 20 different controls. Download these settings and quickly and easily apply them to your web without any additional coding.
MESCIUS Developer Forum
-

Wijmo Blog & Tips
We provide various information to help you use Wijmo effectively.
-

Wijmo Q&A
Please share your concerns and development knowledge with us through the Q&A space.
-

Wijmo FAQ
You can check answers to frequently asked questions.
-

Citizen Insight
This space was created to help alleviate some of the fatigue and stress you may experience while working. Feel free to communicate freely.
-

Citizen Knowledge
In addition to questions about MESCIUS products, this is a space where anyone can freely ask questions and communicate about development/technology.
-

IT Seminar/Meeting
This is a meeting space created for developers and those interested in development to develop together.


Purchase Procedure
Click on each button to see detailed information about each step of the purchasing process.
Controls for Web Developers
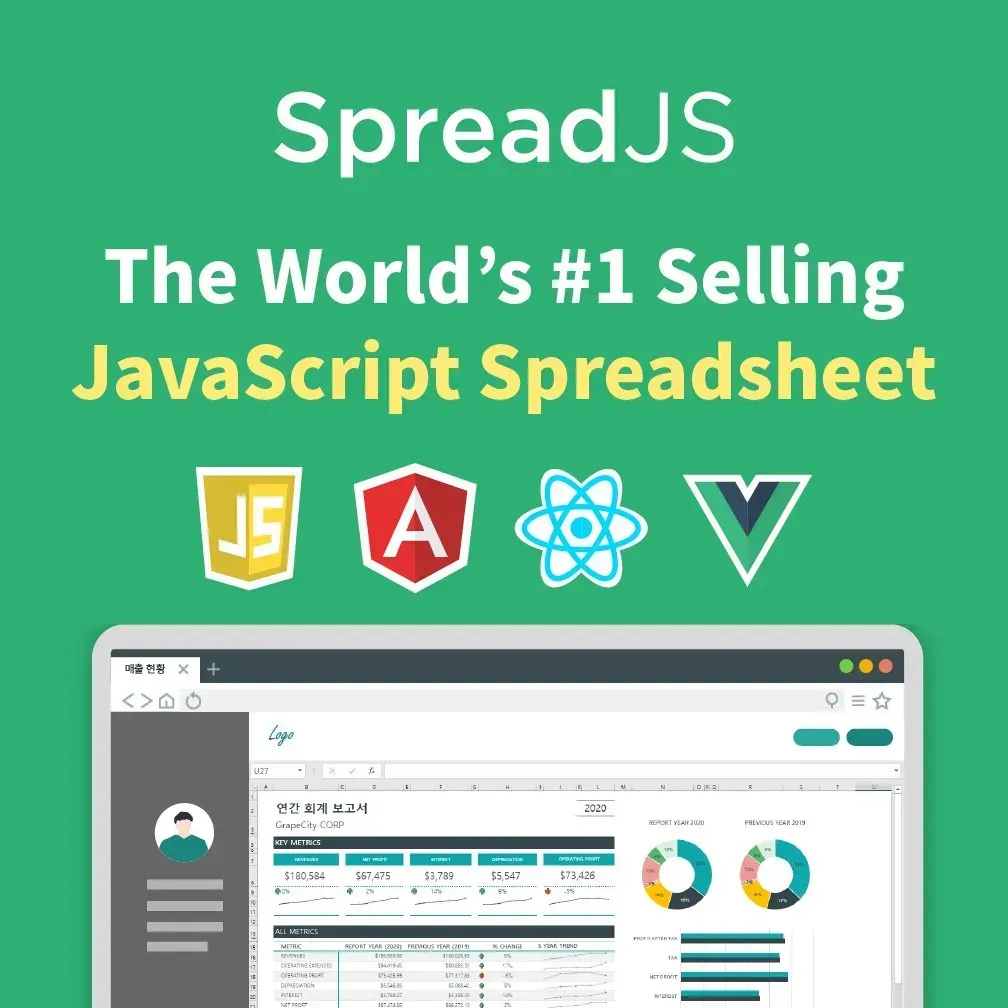
SpreadJS
Pure JavaScript-based Web-Excel Component
- Supports Excel import/export
- Supports 450 Excel functions
- Supports Angular, React, and VueJS
Learn More
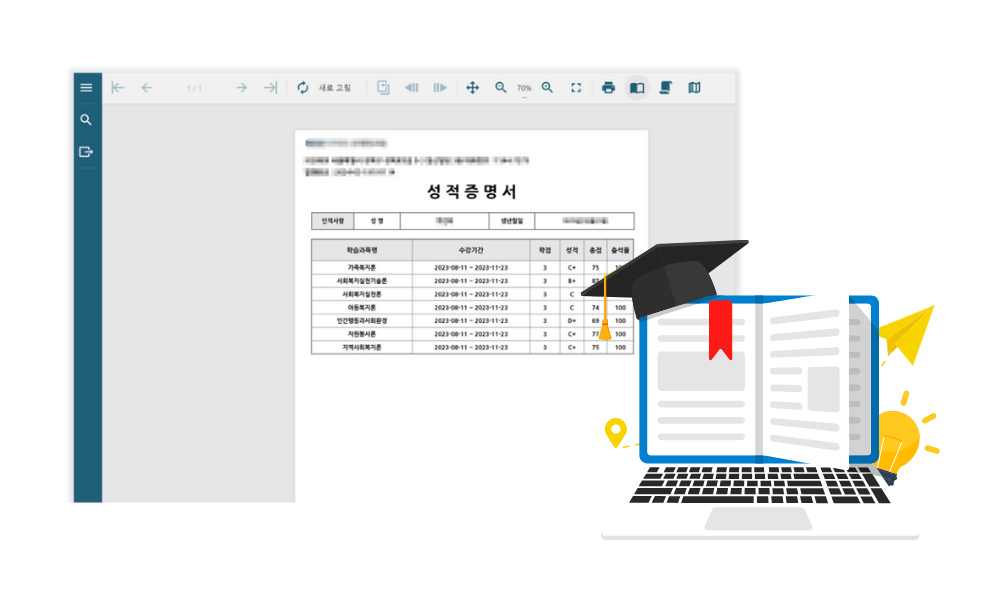
ActiveReportsJS
JavaScript-based Business Reporting Component
- Supports Angular, React, and Vue
- Provides a cross-platform designer program
- Provides a JavaScript report viewer
Learn More
Forguncy
Build Business Web Apps with Excel — No Coding Needed
- Turn Excel features into fast, powerful web apps
- Start web development — no HTML or CSS required
- Unify and collect your business data with ease
Learn More
DsExcel
High-Performance Excel Spreadsheet API for Java, Kotlin, and .NET
- Create, load, edit, and save spreadsheets
- Parse, convert, and share spreadsheets
- Calculate formulas and format cells
DsExcel JavaDsExcel .NET