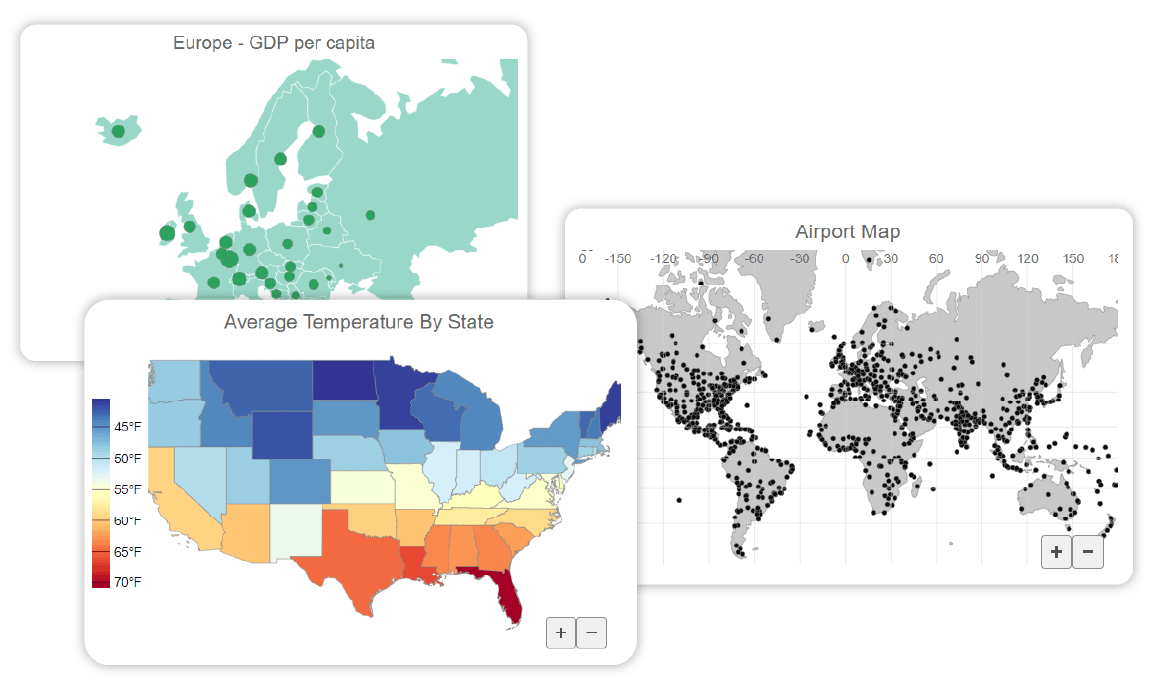
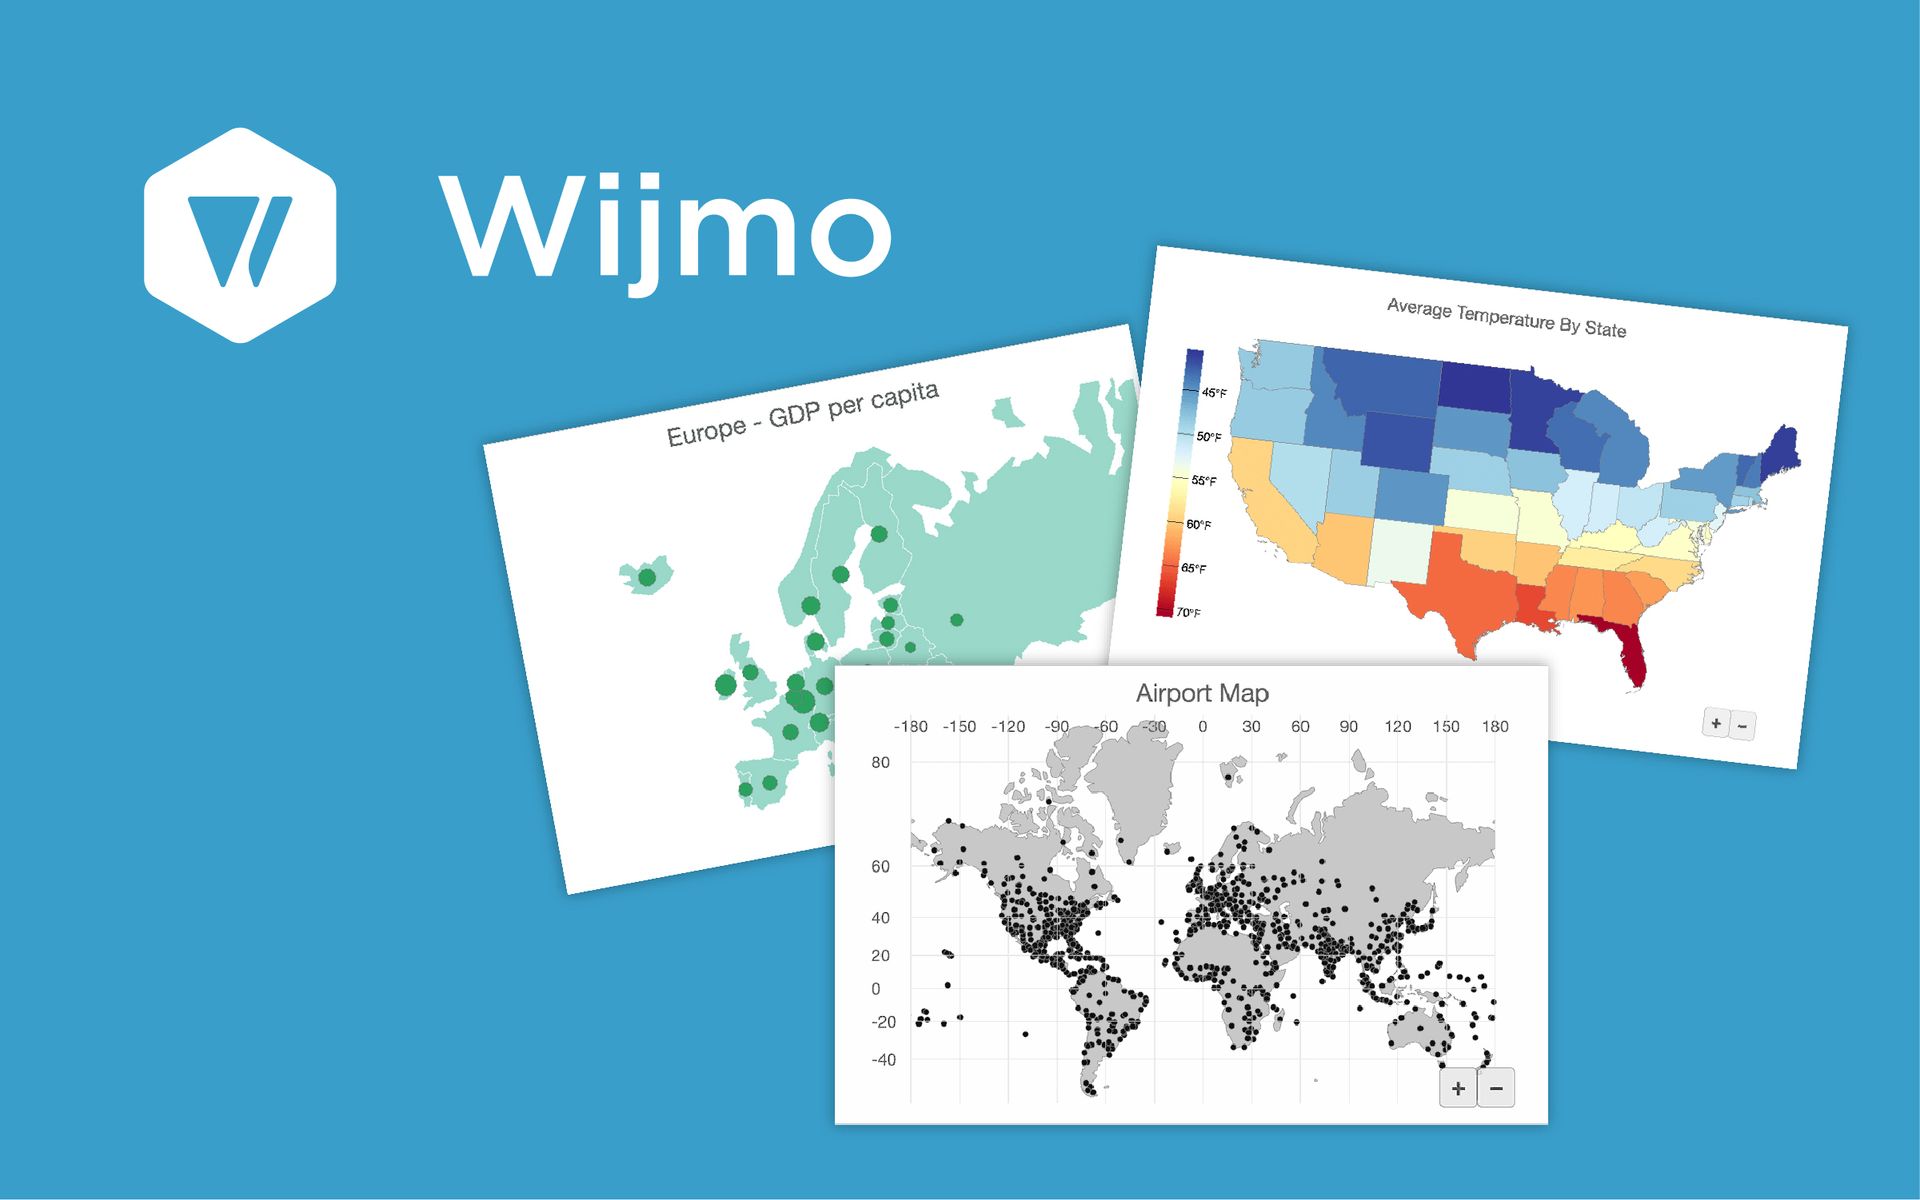
Easily visualize geographic data with JavaScript code using the FlexMap control.

List of Services

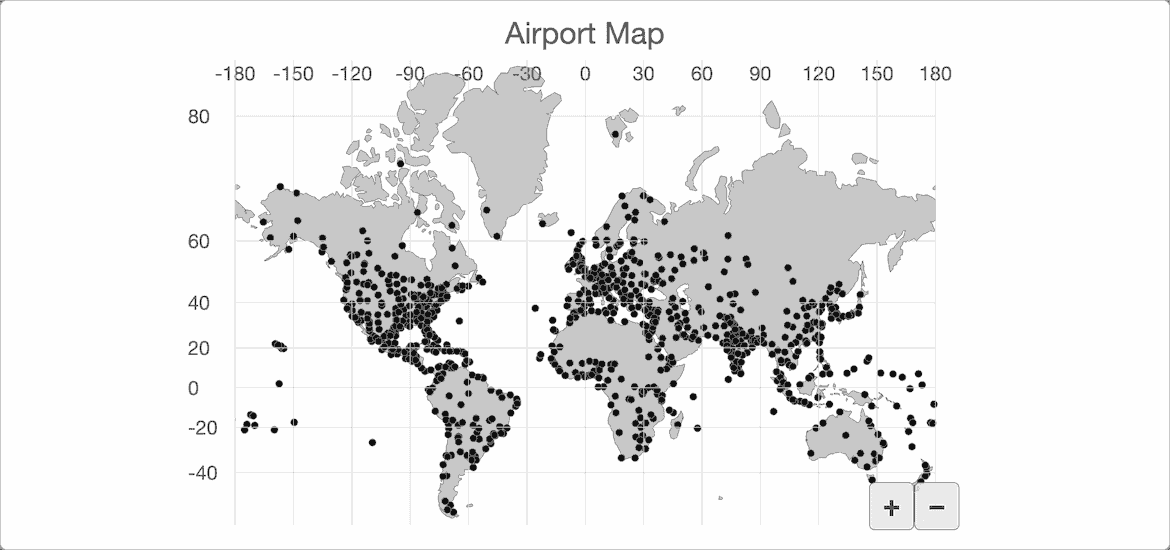
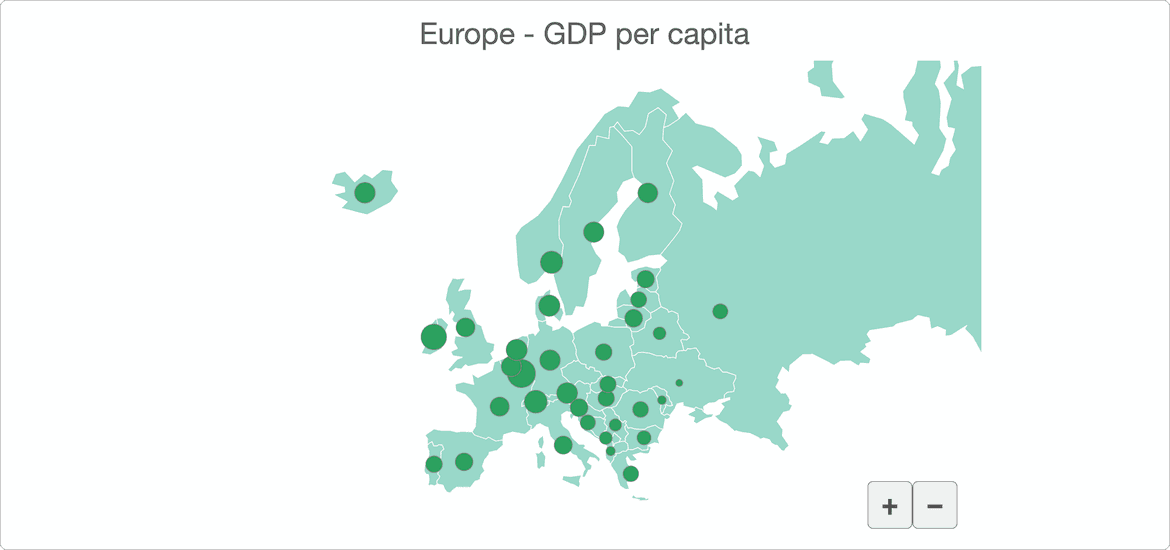
    • Mark points of interest with bubble and scatter maps
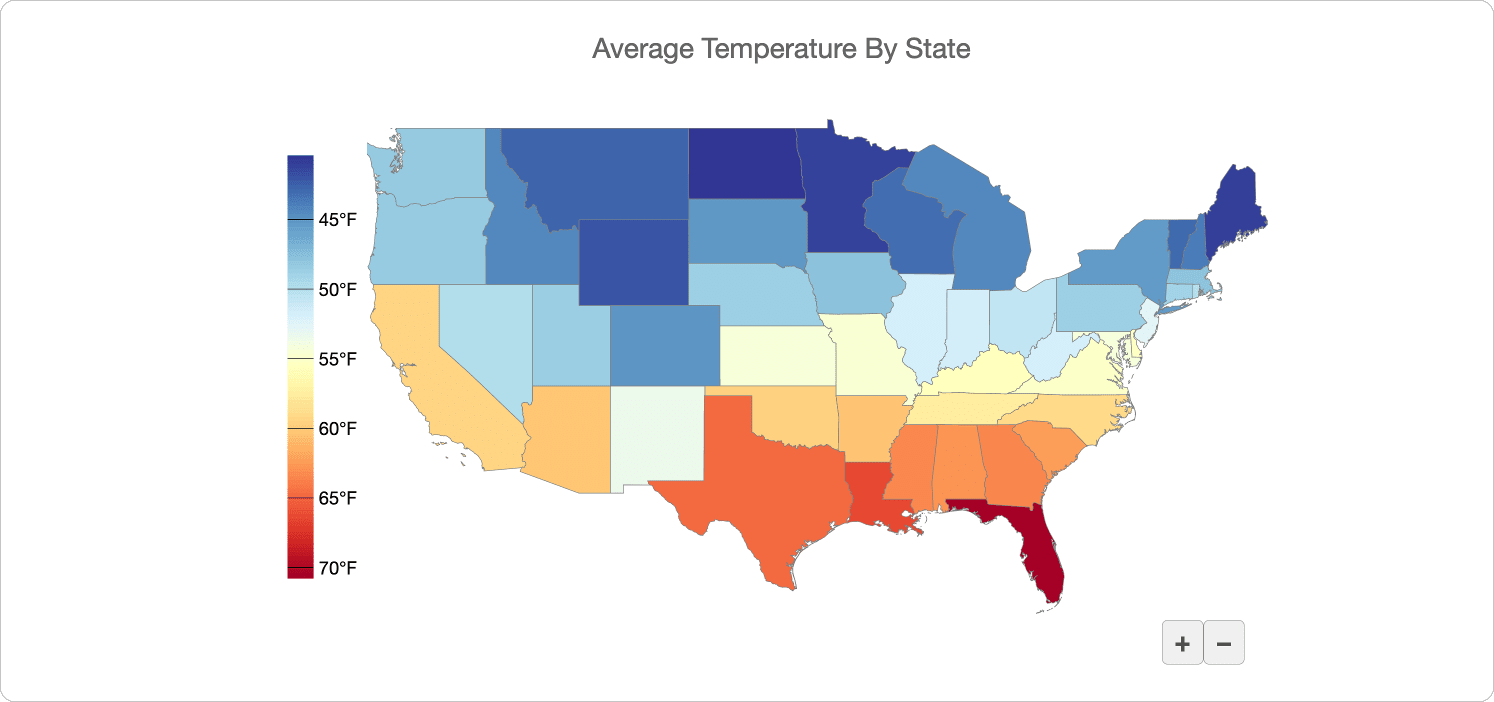
    • Displaying regional statistics using a choropleth map
    • Customize the appearance of your map with dynamic palettes
    • Supports Angular, React, and Vue
    Download Speed Test

    Three special chart types

    Includes bubble and scatter maps for plotting location-specific data, and choropleth maps for plotting region-specific data.

    Lightweight, fast, high-performance charts

    Designed for maximum performance, FlexChart won't slow down your business apps, and it optimizes JavaScript apps to less than 200KB in size.

    JavaScript FlexChart written in TypeScript

    TypeScript lets you develop with the feel of object-oriented languages like C#/Java, with design-time error checking and full IntelliSense capabilities.

    Best framework support

    Built to be framework agnostic, Wijmo includes full support for Angular, AngularJS, ReactJS, Vue.js, Vue3 Beta, and Knockout.

    Flexible and extensible API

    The extensive feature set doesn't bloat the core components. FlexChart includes flexible data binding and pixel-perfect SVG rendering and image export.

    Security level

    Wijmo is Content Security Policy (CSP) compliant, works seamlessly with JavaScript applications without compromising security features.

    Ask anything!

    Please share your concerns and questions about Wijmo with MESCIUS's expert team. We empathize with your concerns and provide assistance.

    Online product consultation Developer Forum (Technical Support)

    JavaScript Map Demo

    Distributed map

    You can use Wijmo's JavaScript distributed map control to display points of interest. Using GeoJSON, you can mark points on the map and display information related to those points.

    Bubble Map

    Bubble maps can be used to mark points of interest on a map and assign values to them. The bubble size depends on the data value (the larger the data, the larger the bubble size).

    Choropleth 맵

    Wijmo's JavaScript Choropleth map control lets you display statistical values for geographic regions. Each region is colored based on the data it represents.

    Tips for using Wijmo

    View more articles

    Discover more ways to use Wijmo.

    Explore Wijmo FlexMap Features

    The map control helps you visualize geographic data sets in a variety of ways. Learn about the FlexMap control's capabilities.

    Mapping JSON Datasets with React Wijmo Bubble Maps

    Learn how to easily build maps with useful overlay data using Wijmo bubble maps.

    Full Wijmo control

    data grid

    DataGrid (FlexGrid)

    OLAP PivotGrid

    Spreadsheet

    MultiRow

    TransposedGrid

    TreeGrid


    Data visualization

    Chart(FlexChart)

    Bar & Column

    Line & Area

    Scatter

    Pie & Sunburst

    Radar & Polar

    Specialized Charts

    FinancialChart

    Maps (FlexMap)

    OLAP PivotChart

    Gauges

    Barcode

    QRCode

    map

    Choropleth Map

    Scatter Map

    Bubble Map

    Navigation & Layout

    Menu

    Popup

    Ribbon

    Tabs

    TreeView


    Input & Editor

    InputsDropDowns

    DateTime

    Numeric

    Colors


    designer

    Wijmo Designer

    VSCode Designer Extension


    viewer

    PdfViewer

    ReportViewer

    Frameworks & Integrations

    Angular

    React

    View

    Web Components

    TypeScript

    ES6


    commonness

    Events

    Globalization

    Glyphs

    Themes

    Data Management

    CollectionView

    REST

    Once

    Firestore

    OAuth

    OLAP


    Printing & Documents

    Print Document

    PDF

    XLSX

    Ask anything!

    Please share your concerns and questions about Wijmo with MESCIUS's expert team. We empathize with your concerns and provide assistance.

    Online product consultation Developer Forum (Technical Support)

    Wijmo Tutorial

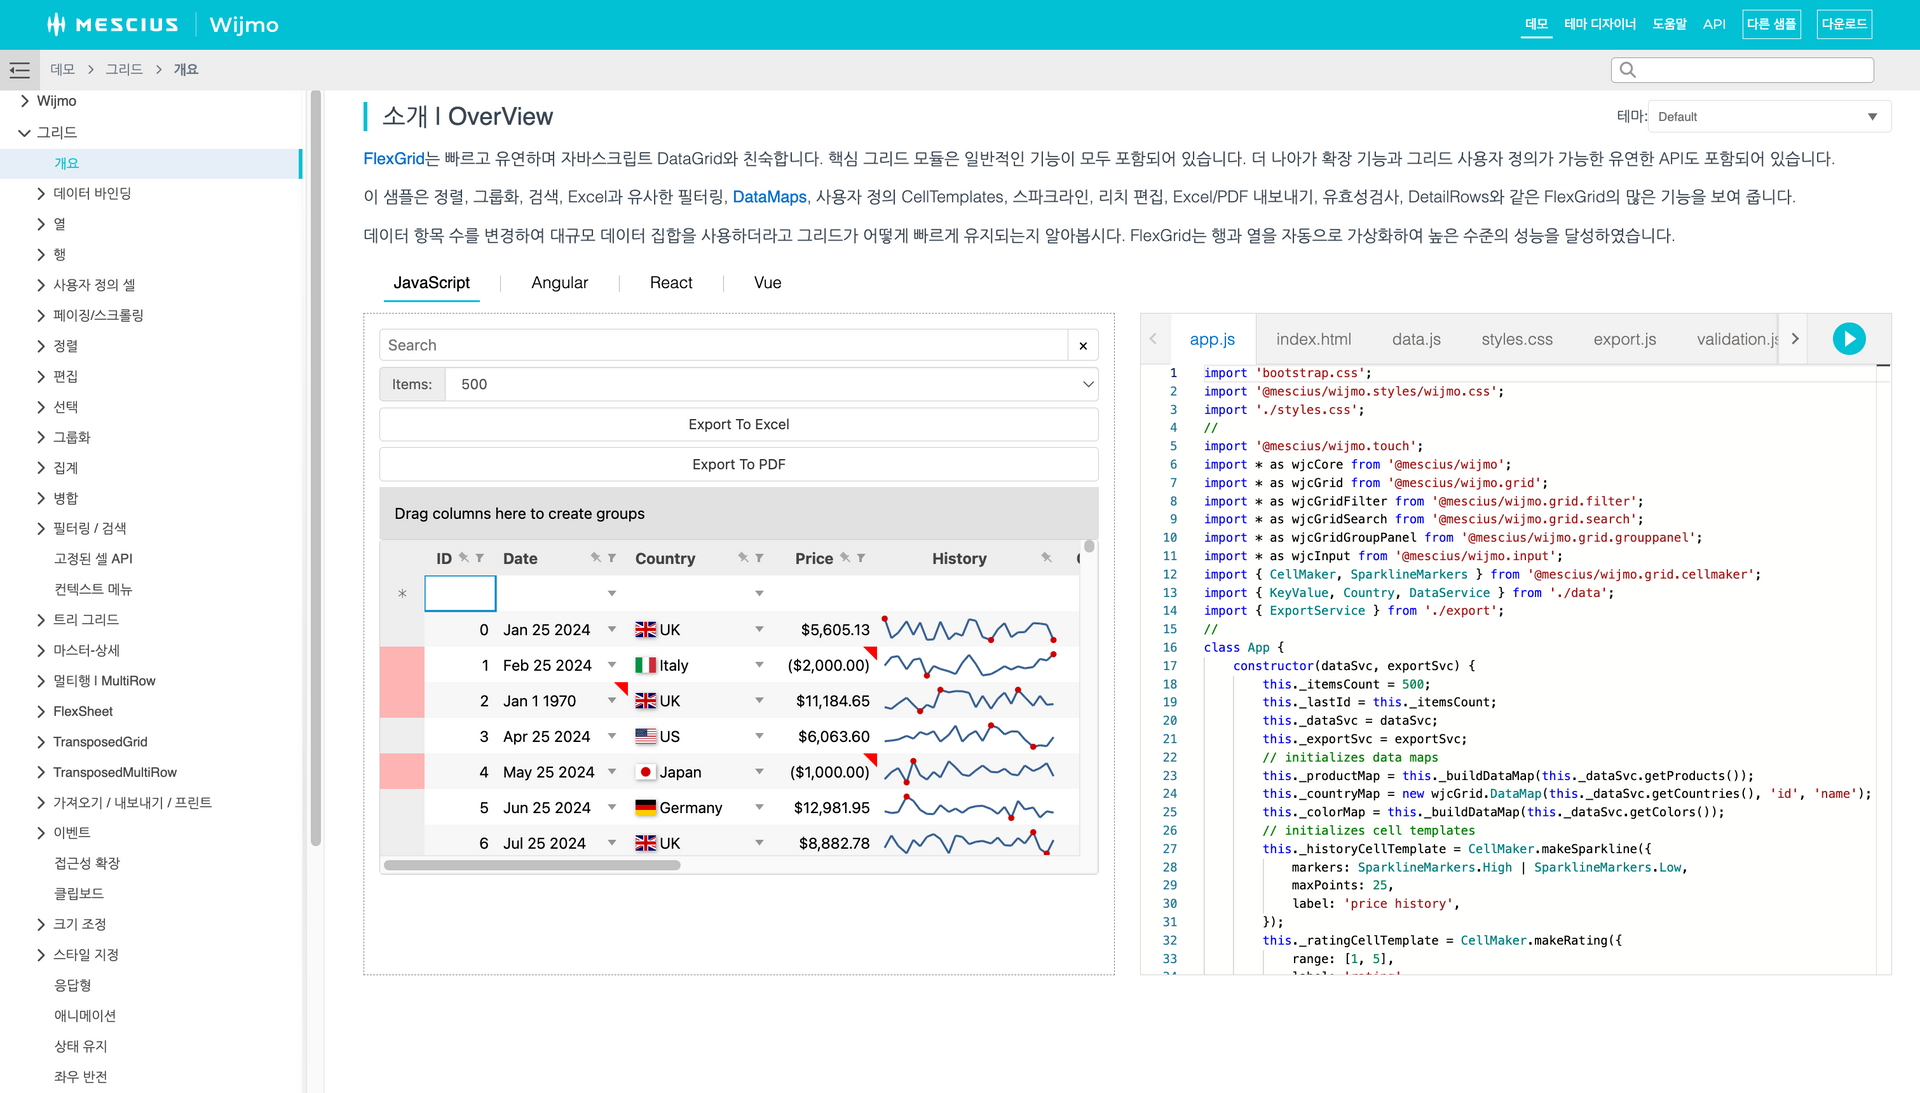
    You can check out the demo and learn how to implement it in practice through the tutorial.


    Provides code for Angular, React, and Vue frameworks.

    Go to online tutorial

    Referencing the Wijmo library

    Local referencing

    CDN referencing

    NPM referencing

    Easily customize Wijmo controls!

    Wijmo CSS Theme Designer

    Easily create design themes using the Wijmo CSS Theme Designer and apply the created CSS to your Wijmo controls!

    Using the Wijmo CSS Theme Designer

    Wijmo Control Properties Editor

    Easily customize the settings of Wijmo controls using the Wijmo Control Properties Editor. You can modify and check the settings for over 20 different controls. Download these settings and quickly and easily apply them to your web without any additional coding.

    Using the Wijmo Control Properties Editor

    Our Customers

    Here Study

    Smart Online Education Bachelor's Management Solution

    #Education #Report #Dashboard

    SW development company I

    Online Commerce AI Big Data Analysis Solution

    #Distribution #Excel #Dashboard

    Gross

    Infrastructure Solutions

    #SW development #manufacturing #dashboard

    Introduction Case

    Explore more MESCIUS product adoption examples.

    Wijmo Pricing and Licenses

    If you want to create JavaScript-based web solutions using Wijmo's UI controls, you will need to purchase both a developer license and a deployment license.

    * All amounts are exclusive of VAT.

    Developer License

    This is the license required to use the official Wijmo JavaScript library.


    ₩1,494,000

    * You must purchase 1 copy per developer.

    Distribution License

    This is a license required to deploy Wijmo's controls on a server, and must be purchased for each domain address or IP address that will ultimately be served.


    ₩1,000,000

    * Once registered, domains and IPs cannot be modified.

    * Please make sure to do a final check before requesting.

    FAQ

    - How to run Wijmo sample files

    - How to register Wijmo distribution licensing

    Application for distribution key issuance

    To deploy Wijmo controls on a server, you must purchase a deployment license and receive a deployment key.

    Please apply for a distribution key through the distribution key issuance portal.

    Introduction Inquiry

    If you need more detailed product and purchase advice regarding Wijmo, please contact us using a method that is convenient for you.

    Request for product and purchase consultation
    Check online quotes and request quotes

    Purchase Procedure

    Click on each button to see detailed information about each step of the purchasing process.

    • 1. Price confirmation and quote request

    • You can request a quote using any of the methods below:
    • Online quote confirmation and quote request
    • 1670-0583
    • sales-kor@mescius.com

    Controls for Web Developers
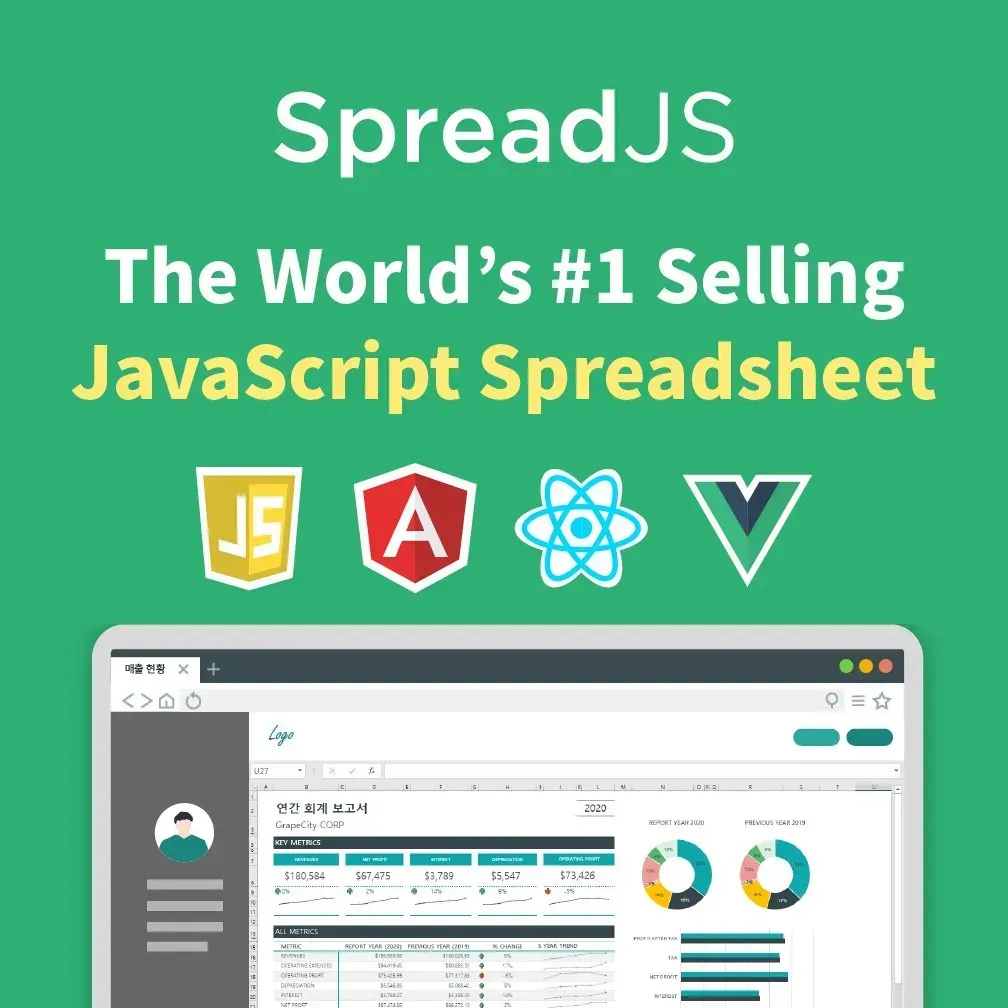
    • SpreadJS

      Pure JavaScript-based Web-Excel component
      • Supports Excel import/export
      • Supports 450 Excel functions
      • Supports Angular, React, and VueJS
      Learn more
    • ActiveReportsJS

      JavaScript-based business reporting component
      • Supports Angular, React, and Vue
      • Provides a cross-platform designer program
      • Provides a JavaScript report viewer
      Learn more
    • Forguncy

      A business web development solution built with Excel without coding.
      • Easy and quick web implementation with Excel features
      • Web development without HTML & CSS
      • Data collection and integration solution
      Learn more
    • DsExcel

      High-performance Java & Kotlin / .NET-based Excel spreadsheet API library
      • Create, load, edit, and save spreadsheets
      • Parse, convert, and share spreadsheets
      • Calculate formulas and format cells
      Learn DsExcel Java
      Learn about DsExcel .NET